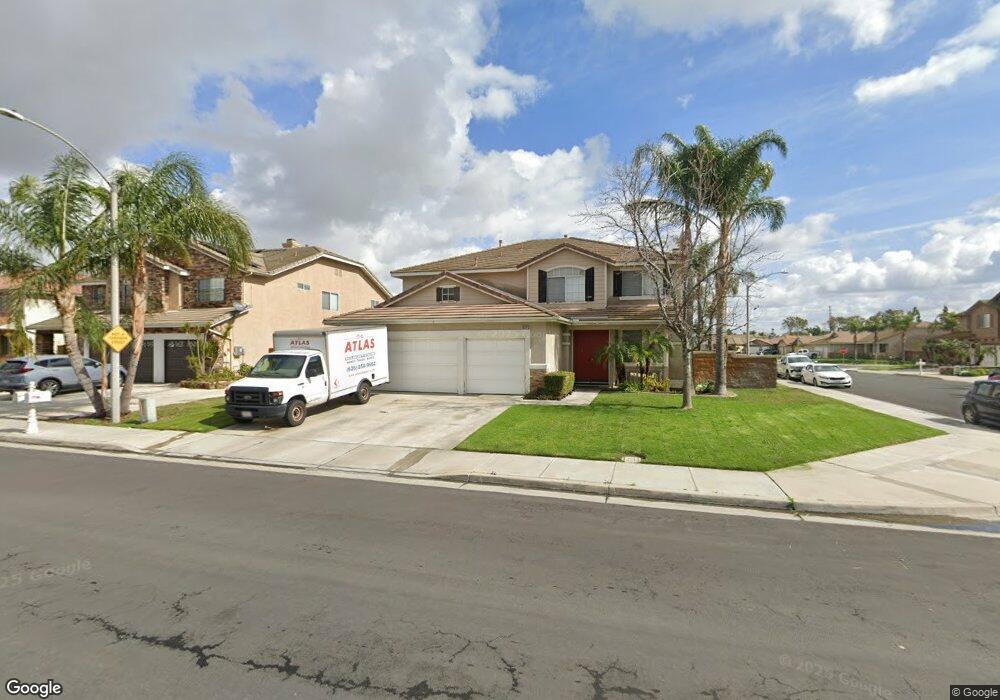
6514 Daffodil Ct Corona, CA 92880
Estimated Value: $948,000 - $997,000
5
Beds
4
Baths
3,340
Sq Ft
$290/Sq Ft
Est. Value
About This Home
This home is located at 6514 Daffodil Ct, Corona, CA 92880 and is currently estimated at $967,034, approximately $289 per square foot. 6514 Daffodil Ct is a home located in Riverside County with nearby schools including Harada Elementary School, River Heights Intermediate School, and Eleanor Roosevelt High School.
Ownership History
Date
Name
Owned For
Owner Type
Purchase Details
Closed on
Aug 5, 2008
Sold by
Harrington David Leon and Harrington Waynetta Marie
Bought by
Onpin Hilarion Trinidad and Ongpin Maria Theresa
Current Estimated Value
Home Financials for this Owner
Home Financials are based on the most recent Mortgage that was taken out on this home.
Original Mortgage
$388,440
Outstanding Balance
$257,062
Interest Rate
6.5%
Mortgage Type
FHA
Estimated Equity
$709,972
Purchase Details
Closed on
Jan 31, 2005
Sold by
Harrington David L and Harrington Marie
Bought by
Harrington David Leon and Harrington Waynetta Marie
Purchase Details
Closed on
Sep 14, 1999
Sold by
Kaufman & Broad Of Southern Ca Inc
Bought by
Harrington David L and Harrington Marie
Home Financials for this Owner
Home Financials are based on the most recent Mortgage that was taken out on this home.
Original Mortgage
$251,450
Interest Rate
7.77%
Mortgage Type
Seller Take Back
Create a Home Valuation Report for This Property
The Home Valuation Report is an in-depth analysis detailing your home's value as well as a comparison with similar homes in the area
Home Values in the Area
Average Home Value in this Area
Purchase History
| Date | Buyer | Sale Price | Title Company |
|---|---|---|---|
| Onpin Hilarion Trinidad | $395,000 | First American Title Company | |
| Harrington David Leon | -- | -- | |
| Harrington David L | $265,000 | First American Title Co |
Source: Public Records
Mortgage History
| Date | Status | Borrower | Loan Amount |
|---|---|---|---|
| Open | Onpin Hilarion Trinidad | $388,440 | |
| Previous Owner | Harrington David L | $251,450 |
Source: Public Records
Tax History
| Year | Tax Paid | Tax Assessment Tax Assessment Total Assessment is a certain percentage of the fair market value that is determined by local assessors to be the total taxable value of land and additions on the property. | Land | Improvement |
|---|---|---|---|---|
| 2025 | $7,707 | $508,645 | $160,959 | $347,686 |
| 2023 | $7,707 | $488,895 | $154,709 | $334,186 |
| 2022 | $7,498 | $479,310 | $151,676 | $327,634 |
| 2021 | $7,350 | $469,912 | $148,702 | $321,210 |
| 2020 | $7,274 | $465,095 | $147,178 | $317,917 |
| 2019 | $7,132 | $455,977 | $144,293 | $311,684 |
| 2018 | $6,975 | $447,037 | $141,465 | $305,572 |
| 2017 | $6,822 | $438,273 | $138,692 | $299,581 |
| 2016 | $6,715 | $429,680 | $135,973 | $293,707 |
| 2015 | $6,591 | $423,229 | $133,932 | $289,297 |
| 2014 | $6,379 | $414,940 | $131,309 | $283,631 |
Source: Public Records
Map
Nearby Homes
- 6695 Goldy St
- 6452 Caxton St
- 12576 Cipriano Ln
- 12533 Cipriano Ln
- 6366 Estrela Ln
- 6567 Moonriver St
- 6386 Delgado Ln
- 6275 Arrifana Ln Unit 6
- 6291 Amarante Ln Unit 227
- 12500 Palmeria Ln
- 6800 Knightsbridge Ct
- 6760 Rico Ct
- 6396 Pictor Ct
- 6749 Rico Ct
- 12456 Cassiopeia Ct
- 12463 Phoenix Ct
- 12343 Black Horse St
- 6336 Andromeda Ct
- 12450 Travanca Ln
- 6737 Borges St
- 6504 Daffodil Ct
- 6515 Marigold St
- 6505 Marigold St
- 6494 Daffodil Ct
- 12685 Dandelion St
- 6517 Daffodil Ct
- 12705 Dandelion St
- 6507 Daffodil Ct
- 6495 Marigold St
- 12675 Dandelion St
- 6484 Daffodil Ct
- 6497 Daffodil Ct
- 12715 Dandelion St
- 6485 Marigold St
- 12700 Carnation St
- 12690 Carnation St
- 6516 Lavender St
- 12710 Carnation St
- 6487 Daffodil Ct
- 12680 Carnation St
Your Personal Tour Guide
Ask me questions while you tour the home.