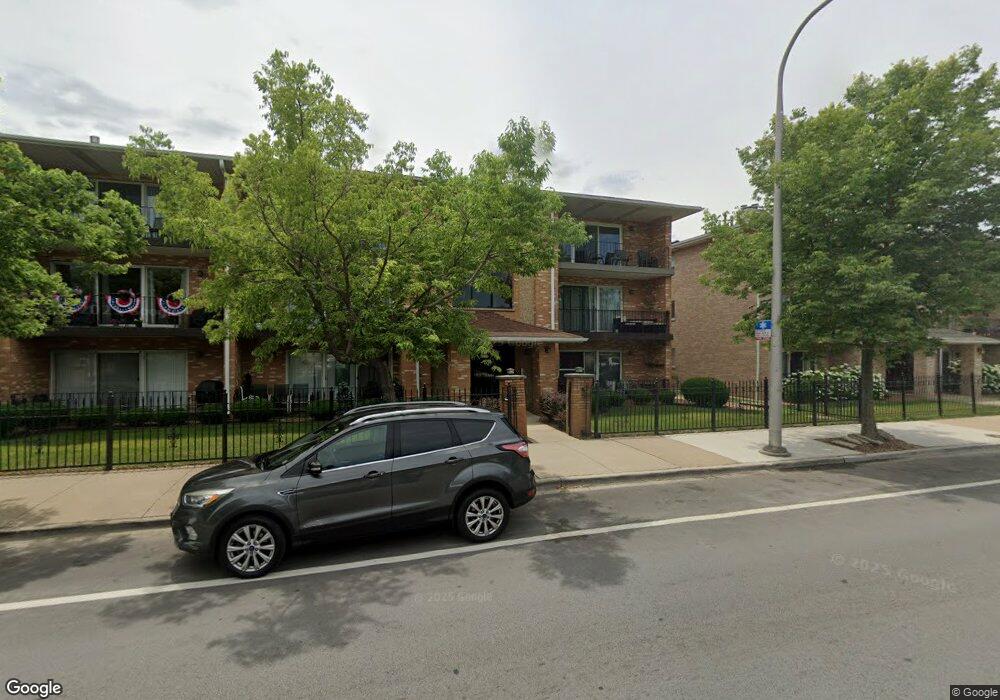
6515 W 63rd St Unit 65153B Chicago, IL 60638
Clearing NeighborhoodEstimated Value: $214,000 - $255,000
2
Beds
2
Baths
1,050
Sq Ft
$221/Sq Ft
Est. Value
About This Home
This home is located at 6515 W 63rd St Unit 65153B, Chicago, IL 60638 and is currently estimated at $231,721, approximately $220 per square foot. 6515 W 63rd St Unit 65153B is a home located in Cook County with nearby schools including Dore Elementary School, Kennedy High School, and St. Symphorosa Catholic School.
Ownership History
Date
Name
Owned For
Owner Type
Purchase Details
Closed on
Jun 20, 2023
Sold by
Hooker Tad R
Bought by
Sanchez Morgan
Current Estimated Value
Home Financials for this Owner
Home Financials are based on the most recent Mortgage that was taken out on this home.
Original Mortgage
$156,800
Interest Rate
6.25%
Mortgage Type
New Conventional
Purchase Details
Closed on
Jun 1, 2017
Sold by
Green Kevin P and Flores Adele
Bought by
Hooker Tad R
Home Financials for this Owner
Home Financials are based on the most recent Mortgage that was taken out on this home.
Original Mortgage
$74,500
Interest Rate
4.03%
Mortgage Type
New Conventional
Purchase Details
Closed on
Dec 6, 1996
Sold by
Sabatino Peter and Sabatino Sally
Bought by
Green Kevin R
Home Financials for this Owner
Home Financials are based on the most recent Mortgage that was taken out on this home.
Original Mortgage
$97,900
Interest Rate
7.65%
Create a Home Valuation Report for This Property
The Home Valuation Report is an in-depth analysis detailing your home's value as well as a comparison with similar homes in the area
Home Values in the Area
Average Home Value in this Area
Purchase History
| Date | Buyer | Sale Price | Title Company |
|---|---|---|---|
| Sanchez Morgan | $196,000 | Citywide Title | |
| Hooker Tad R | $117,000 | Fidelity National Title | |
| Green Kevin R | $113,000 | -- |
Source: Public Records
Mortgage History
| Date | Status | Borrower | Loan Amount |
|---|---|---|---|
| Previous Owner | Sanchez Morgan | $156,800 | |
| Previous Owner | Hooker Tad R | $74,500 | |
| Previous Owner | Green Kevin R | $97,900 |
Source: Public Records
Tax History Compared to Growth
Tax History
| Year | Tax Paid | Tax Assessment Tax Assessment Total Assessment is a certain percentage of the fair market value that is determined by local assessors to be the total taxable value of land and additions on the property. | Land | Improvement |
|---|---|---|---|---|
| 2024 | $2,054 | $18,031 | $1,669 | $16,362 |
| 2023 | $1,981 | $13,000 | $1,478 | $11,522 |
| 2022 | $1,981 | $13,000 | $1,478 | $11,522 |
| 2021 | $1,944 | $12,999 | $1,478 | $11,521 |
| 2020 | $1,308 | $8,936 | $1,192 | $7,744 |
| 2019 | $1,317 | $9,945 | $1,192 | $8,753 |
| 2018 | $1,294 | $9,945 | $1,192 | $8,753 |
| 2017 | $1,132 | $8,599 | $1,072 | $7,527 |
| 2016 | $1,230 | $8,599 | $1,072 | $7,527 |
| 2015 | $1,103 | $8,599 | $1,072 | $7,527 |
| 2014 | $1,641 | $11,344 | $1,013 | $10,331 |
| 2013 | $1,598 | $11,344 | $1,013 | $10,331 |
Source: Public Records
Map
Nearby Homes
- 6525 W 63rd St Unit 1B
- 6206 S Nashville Ave
- 6359 W 63rd Place
- 6430 W 64th Place
- 6416 W 64th Place Unit 3A
- 6322 W 63rd Place
- 6632 W 64th Place Unit 3
- 6637 W 64th Place
- 6104 S Nashville Ave
- 6209 W 63rd Place
- 6031 S Normandy Ave
- 6154 W 63rd St Unit 3W
- 6850 W 64th St
- 6857 W 63rd Place
- 6046 S Melvina Ave
- 6120 W 65th St Unit 5
- 6201 S Meade Ave
- 6927 W 64th Place Unit 2E
- 6158 W 60th St Unit 10
- 6220 S Mcvicker Ave
- 6509 W 63rd St Unit 65092A
- 6509 W 63rd St Unit 3B
- 6509 W 63rd St Unit 3A
- 6509 W 63rd St Unit 65091B
- 6509 W 63rd St Unit 1B
- 6509 W 63rd St Unit 2B
- 6509 W 63rd St Unit 1A
- 6515 W 63rd St Unit 65153A
- 6505 W 63rd St Unit 6515-1A
- 6505 W 63rd St Unit 6515-2B
- 6515 W 63rd St Unit 65152A
- 6505 W 63rd St Unit 6509-1A
- 6515 W 63rd St Unit 65151B
- 6505 W 63rd St Unit 6509-2B
- 6515 W 63rd St Unit 3B
- 6515 W 63rd St Unit 3A
- 6515 W 63rd St Unit 2A
- 6513 W 63rd St
- 6501 W 63rd St
- 6519 W 63rd St Unit 3B