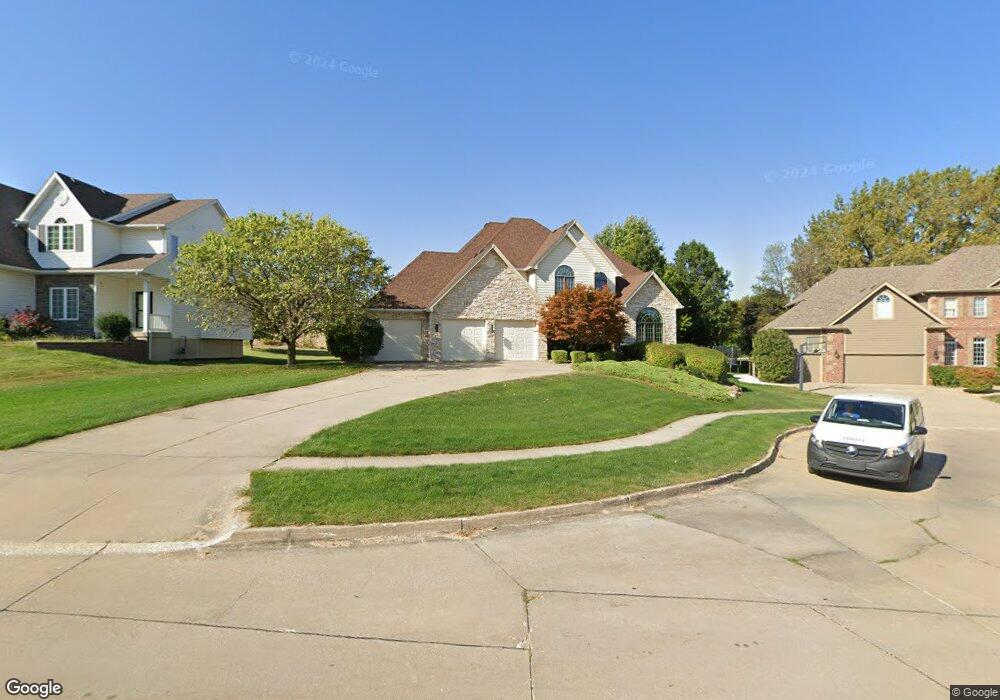
6516 NW 95th Ct Johnston, IA 50131
Northwest Johnston NeighborhoodEstimated Value: $615,000 - $748,282
4
Beds
5
Baths
2,988
Sq Ft
$237/Sq Ft
Est. Value
About This Home
This home is located at 6516 NW 95th Ct, Johnston, IA 50131 and is currently estimated at $709,071, approximately $237 per square foot. 6516 NW 95th Ct is a home located in Polk County with nearby schools including Beaver Creek Elementary School, Summit Middle School, and Johnston Middle School.
Ownership History
Date
Name
Owned For
Owner Type
Purchase Details
Closed on
Nov 25, 2020
Sold by
Roberts Lori
Bought by
Roberts Lori and Barker Nicholas
Current Estimated Value
Purchase Details
Closed on
Sep 12, 2019
Sold by
Roberts Richard
Bought by
Roberts Richard and Roberts Lori
Purchase Details
Closed on
Mar 25, 2003
Sold by
Walters Development Co Ltd
Bought by
Roberts Richard and Roberts Sarah
Home Financials for this Owner
Home Financials are based on the most recent Mortgage that was taken out on this home.
Original Mortgage
$310,000
Outstanding Balance
$133,852
Interest Rate
5.94%
Estimated Equity
$575,219
Purchase Details
Closed on
Nov 22, 2000
Sold by
Johnston Land Co Lc
Bought by
Walters Development Company Ltd
Home Financials for this Owner
Home Financials are based on the most recent Mortgage that was taken out on this home.
Original Mortgage
$405,500
Interest Rate
7.87%
Create a Home Valuation Report for This Property
The Home Valuation Report is an in-depth analysis detailing your home's value as well as a comparison with similar homes in the area
Home Values in the Area
Average Home Value in this Area
Purchase History
| Date | Buyer | Sale Price | Title Company |
|---|---|---|---|
| Roberts Lori | -- | None Available | |
| Roberts Richard | -- | None Available | |
| Roberts Richard | $458,500 | -- | |
| Walters Development Company Ltd | -- | -- |
Source: Public Records
Mortgage History
| Date | Status | Borrower | Loan Amount |
|---|---|---|---|
| Open | Roberts Richard | $310,000 | |
| Previous Owner | Walters Development Company Ltd | $405,500 |
Source: Public Records
Tax History Compared to Growth
Tax History
| Year | Tax Paid | Tax Assessment Tax Assessment Total Assessment is a certain percentage of the fair market value that is determined by local assessors to be the total taxable value of land and additions on the property. | Land | Improvement |
|---|---|---|---|---|
| 2025 | $12,316 | $795,800 | $119,900 | $675,900 |
| 2024 | $12,316 | $744,800 | $110,900 | $633,900 |
| 2023 | $11,376 | $744,800 | $110,900 | $633,900 |
| 2022 | $12,710 | $605,500 | $94,100 | $511,400 |
| 2021 | $13,294 | $605,500 | $94,100 | $511,400 |
| 2020 | $13,072 | $603,000 | $92,700 | $510,300 |
| 2019 | $13,144 | $603,000 | $92,700 | $510,300 |
| 2018 | $12,806 | $562,500 | $84,800 | $477,700 |
| 2017 | $11,986 | $562,500 | $84,800 | $477,700 |
| 2016 | $11,730 | $516,800 | $70,800 | $446,000 |
| 2015 | $11,730 | $516,800 | $70,800 | $446,000 |
| 2014 | $11,712 | $509,200 | $68,800 | $440,400 |
Source: Public Records
Map
Nearby Homes
- 9504 NW Newgate Dr
- 6511 NW 93rd St
- 9524 Wickham Dr
- 9115 Telford Cir
- 9115 Cowden Dr
- 6713 NW 99th St
- 6725 NW 93rd St
- 6296 Sudbury Ct
- 10100 Catalina Dr
- 10014 NW 68th Ave
- 6724 Bright St
- 6720 Bright St
- 6732 Bright St
- 10123 NW 68th Ave
- 10009 Powell Ave
- 9425 Woodland Dr
- 6532 Cheslie Ct
- 10325 Providence Dr Unit 102
- 10240 Powell Ave
- 6101 Manchester Ln
- 6512 NW 95th Ct
- 6520 NW 95th Ct
- 9501 NW Newgate Dr
- 6524 NW 95th Ct
- 6515 NW 95th Ct
- 9505 NW Newgate Dr
- 6511 NW 95th Ct
- 6519 NW 95th Ct
- 6523 NW 95th Ct
- 9416 NW Newgate Dr
- 9509 NW Newgate Dr
- 9412 NW Newgate Dr
- 9500 NW Newgate Dr
- 6516 NW 94th Ct
- 6520 NW 94th Ct
- 9408 NW Newgate Dr
- 6512 NW 94th Ct
- 9513 NW Newgate Dr
- 9404 NW Newgate Dr
- 6427 NW 95th St