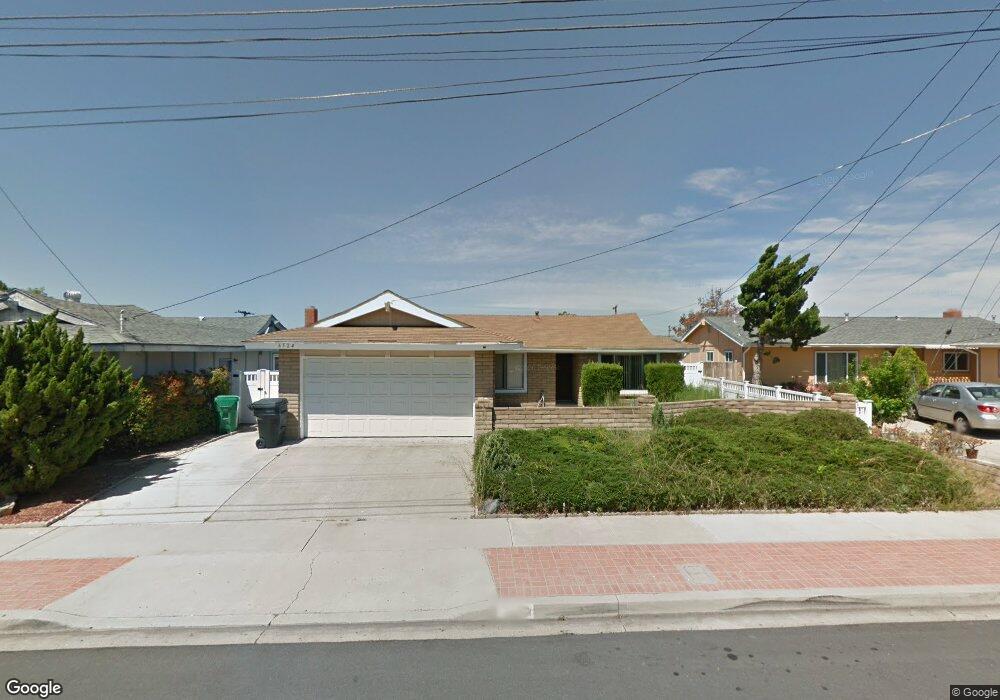
6524 Cascade St San Diego, CA 92122
University City NeighborhoodEstimated Value: $1,198,299 - $1,566,000
3
Beds
2
Baths
1,064
Sq Ft
$1,331/Sq Ft
Est. Value
About This Home
This home is located at 6524 Cascade St, San Diego, CA 92122 and is currently estimated at $1,416,575, approximately $1,331 per square foot. 6524 Cascade St is a home located in San Diego County with nearby schools including Spreckels Elementary School, Standley Middle School, and University City High School.
Ownership History
Date
Name
Owned For
Owner Type
Purchase Details
Closed on
Sep 15, 2016
Sold by
Daison Llc
Bought by
Isakovic Ljubomir and Milutinovic Snezana
Current Estimated Value
Home Financials for this Owner
Home Financials are based on the most recent Mortgage that was taken out on this home.
Original Mortgage
$556,000
Outstanding Balance
$444,397
Interest Rate
3.45%
Mortgage Type
New Conventional
Estimated Equity
$972,178
Purchase Details
Closed on
Mar 31, 2016
Sold by
Jones Ricky L
Bought by
Daison Llc
Purchase Details
Closed on
May 14, 2001
Sold by
Nugteren Henry and Nugteren Mary C
Bought by
Jones Ricky L
Home Financials for this Owner
Home Financials are based on the most recent Mortgage that was taken out on this home.
Original Mortgage
$325,000
Interest Rate
7.14%
Mortgage Type
Seller Take Back
Purchase Details
Closed on
Feb 13, 1989
Sold by
Henry Nugteren and Henry Mary C
Bought by
Nugteren Henry and Nugteren Mary C
Purchase Details
Closed on
Dec 15, 1986
Create a Home Valuation Report for This Property
The Home Valuation Report is an in-depth analysis detailing your home's value as well as a comparison with similar homes in the area
Home Values in the Area
Average Home Value in this Area
Purchase History
| Date | Buyer | Sale Price | Title Company |
|---|---|---|---|
| Isakovic Ljubomir | $695,000 | Title 365 | |
| Daison Llc | $547,000 | None Available | |
| Jones Ricky L | $345,000 | Chicago Title Co | |
| Nugteren Henry | -- | -- | |
| -- | $142,000 | -- |
Source: Public Records
Mortgage History
| Date | Status | Borrower | Loan Amount |
|---|---|---|---|
| Open | Isakovic Ljubomir | $556,000 | |
| Previous Owner | Jones Ricky L | $325,000 |
Source: Public Records
Tax History Compared to Growth
Tax History
| Year | Tax Paid | Tax Assessment Tax Assessment Total Assessment is a certain percentage of the fair market value that is determined by local assessors to be the total taxable value of land and additions on the property. | Land | Improvement |
|---|---|---|---|---|
| 2025 | $9,660 | $806,598 | $722,550 | $84,048 |
| 2024 | $9,660 | $790,783 | $708,383 | $82,400 |
| 2023 | $9,446 | $775,279 | $694,494 | $80,785 |
| 2022 | $9,193 | $760,078 | $680,877 | $79,201 |
| 2021 | $9,129 | $745,176 | $667,527 | $77,649 |
| 2020 | $9,017 | $737,536 | $660,683 | $76,853 |
| 2019 | $8,855 | $723,076 | $647,729 | $75,347 |
| 2018 | $8,277 | $708,899 | $635,029 | $73,870 |
| 2017 | $8,079 | $695,000 | $622,578 | $72,422 |
| 2016 | $5,186 | $439,137 | $273,667 | $165,470 |
| 2015 | $5,110 | $432,542 | $269,557 | $162,985 |
| 2014 | $5,030 | $424,070 | $264,277 | $159,793 |
Source: Public Records
Map
Nearby Homes
- 6614 Dennison St
- 6547 Radcliffe Dr
- 6330 Genesee Ave Unit 319
- 6330 Genesee Ave Unit 220
- 6330 Genesee Ave Unit 119
- 6330 Genesee Ave Unit 112
- 6330 Genesee Ave Unit 213
- 6350 Genesee Ave Unit 107
- 6330 Genesee Ave Unit 103
- 3542 Governor Dr
- 6190 Agee St Unit 260
- 6188 Agee St Unit 230
- 6214 Agee St Unit 34
- 6036 Tulane St
- 4146 Camino Ticino
- 7915 Camino Kiosco
- 4224 Governor Dr
- 7849 Camino Glorita
- 3598 Syracuse Ave
- 7833 Camino Huerta
- 6512 Cascade St
- 6536 Cascade St
- 6549 Dennison St
- 6569 Dennison St
- 6472 Cascade St
- 6548 Cascade St
- 6529 Dennison St
- 6611 Dennison St
- 6521 Cascade St
- 6509 Cascade St
- 6561 Cascade St
- 6454 Cascade St
- 6509 Dennison St
- 6631 Dennison St
- 6481 Dennison St
- 6455 Cascade St
- 6651 Dennison St
- 3724 Cascade Ct
- 6436 Cascade St
- 6603 Cascade St