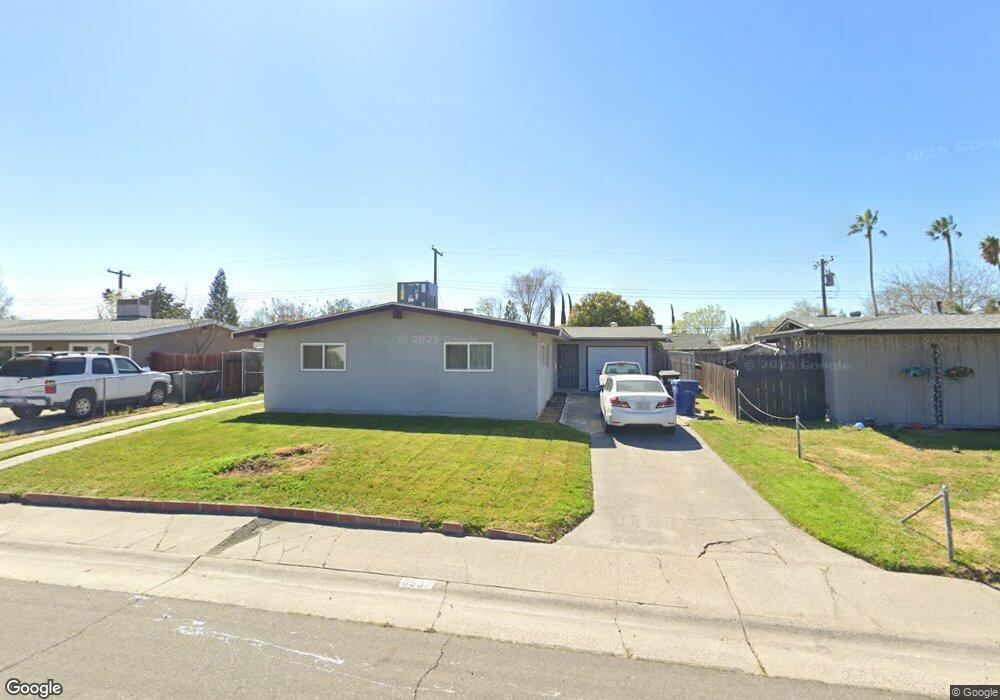
6537 Pearson Ln North Highlands, CA 95660
Larchmont Village NeighborhoodEstimated Value: $364,000 - $422,000
3
Beds
2
Baths
1,272
Sq Ft
$307/Sq Ft
Est. Value
About This Home
This home is located at 6537 Pearson Ln, North Highlands, CA 95660 and is currently estimated at $390,239, approximately $306 per square foot. 6537 Pearson Ln is a home located in Sacramento County with nearby schools including Village Elementary School, Highlands High School, and Creative Connections Arts Academy.
Ownership History
Date
Name
Owned For
Owner Type
Purchase Details
Closed on
Sep 14, 2023
Sold by
Span Joyce Ann
Bought by
Joyce Ann Span Living Trust and Span
Current Estimated Value
Purchase Details
Closed on
Apr 12, 2018
Sold by
Nichols Geraldine and Span Joyce Ann
Bought by
Span Joyce Ann
Home Financials for this Owner
Home Financials are based on the most recent Mortgage that was taken out on this home.
Original Mortgage
$60,654
Interest Rate
4.46%
Mortgage Type
New Conventional
Purchase Details
Closed on
Dec 17, 1997
Sold by
Armstrong Richard S and Armstrong Ingeborg
Bought by
Nichols Geraldine and Span Joyce Ann
Home Financials for this Owner
Home Financials are based on the most recent Mortgage that was taken out on this home.
Original Mortgage
$85,072
Interest Rate
7.23%
Mortgage Type
FHA
Purchase Details
Closed on
Sep 23, 1997
Sold by
Federal National Mortgage Association
Bought by
Armstrong Richard S and Armstrong Ingeborg
Purchase Details
Closed on
Dec 23, 1996
Sold by
Taylor Margaret and Taylor Robert S
Bought by
Federal National Mortgage Association
Create a Home Valuation Report for This Property
The Home Valuation Report is an in-depth analysis detailing your home's value as well as a comparison with similar homes in the area
Home Values in the Area
Average Home Value in this Area
Purchase History
| Date | Buyer | Sale Price | Title Company |
|---|---|---|---|
| Joyce Ann Span Living Trust | -- | None Listed On Document | |
| Span Joyce Ann | $61,000 | None Available | |
| Nichols Geraldine | $85,500 | Chicago Title Co | |
| Armstrong Richard S | $50,000 | Chicago Title Co | |
| Federal National Mortgage Association | -- | United Independent Title |
Source: Public Records
Mortgage History
| Date | Status | Borrower | Loan Amount |
|---|---|---|---|
| Previous Owner | Span Joyce Ann | $60,654 | |
| Previous Owner | Nichols Geraldine | $85,072 |
Source: Public Records
Tax History
| Year | Tax Paid | Tax Assessment Tax Assessment Total Assessment is a certain percentage of the fair market value that is determined by local assessors to be the total taxable value of land and additions on the property. | Land | Improvement |
|---|---|---|---|---|
| 2025 | $2,243 | $199,078 | $56,923 | $142,155 |
| 2024 | $2,243 | $195,175 | $55,807 | $139,368 |
| 2023 | $2,259 | $191,349 | $54,713 | $136,636 |
| 2022 | $2,126 | $187,598 | $53,641 | $133,957 |
| 2021 | $2,120 | $183,921 | $52,590 | $131,331 |
| 2020 | $2,101 | $182,036 | $52,051 | $129,985 |
| 2019 | $2,074 | $178,468 | $51,031 | $127,437 |
| 2018 | $1,354 | $119,966 | $35,073 | $84,893 |
| 2017 | $1,389 | $117,615 | $34,386 | $83,229 |
| 2016 | $1,390 | $115,310 | $33,712 | $81,598 |
| 2015 | $1,306 | $113,579 | $33,206 | $80,373 |
| 2014 | $1,332 | $111,355 | $32,556 | $78,799 |
Source: Public Records
Map
Nearby Homes
- 6505 Pearson Ln
- 6605 Whitsett Dr
- 6518 Whitsett Dr
- 6600 Whitsett Dr
- 3920 Floral Dr
- 6535 La Cienega Dr
- 6500 Salida Way
- 6353 La Cienega Dr
- 6445 Channing Dr
- 6824 Lumry St
- 4024 Alta Lorraine Way
- 6449 Larry Way
- 6333 Whitecliff Way
- 6505 Channing Dr
- 6913 Weddigen Way
- 7006 Plumber Way
- 3628 Floral Dr
- 5851 Larry Way
- 4061 Cornelia Way
- 3910 Don Julio Blvd
- 6541 Pearson Ln
- 6533 Pearson Ln
- 6536 Graylock Ln
- 6540 Graylock Ln
- 6545 Pearson Ln
- 6532 Graylock Ln
- 6529 Pearson Ln
- 6544 Graylock Ln
- 6538 Pearson Ln
- 6532 Pearson Ln
- 6544 Pearson Ln
- 6528 Graylock Ln
- 6528 Pearson Ln
- 6525 Pearson Ln
- 6548 Graylock Ln
- 6634 Melrose Dr
- 6628 Melrose Dr
- 6524 Graylock Ln
- 6524 Pearson Ln
- 6646 Melrose Dr
Your Personal Tour Guide
Ask me questions while you tour the home.