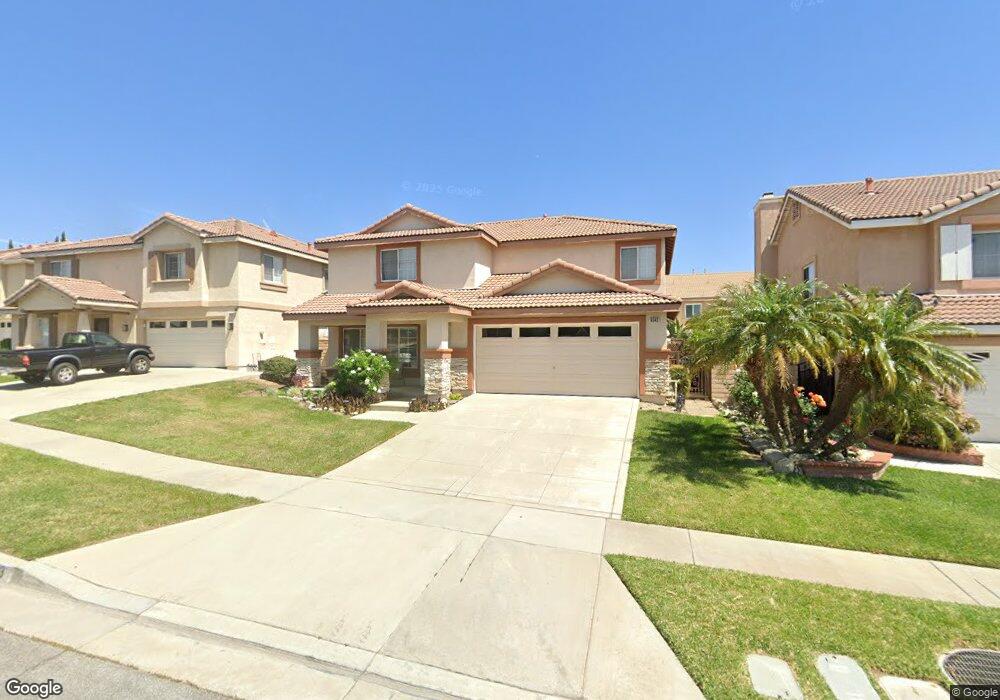
6543 Montecarlo Place Rancho Cucamonga, CA 91701
Victoria NeighborhoodEstimated Value: $874,433 - $960,000
4
Beds
3
Baths
2,262
Sq Ft
$403/Sq Ft
Est. Value
About This Home
This home is located at 6543 Montecarlo Place, Rancho Cucamonga, CA 91701 and is currently estimated at $911,858, approximately $403 per square foot. 6543 Montecarlo Place is a home located in San Bernardino County with nearby schools including Carleton P. Lightfoot Elementary, Day Creek Intermediate, and Rancho Cucamonga High School.
Ownership History
Date
Name
Owned For
Owner Type
Purchase Details
Closed on
Dec 28, 2012
Sold by
Cheng Garland
Bought by
Chan Cheng Garland and Chan Cheng Rebecca Mei
Current Estimated Value
Purchase Details
Closed on
Jun 27, 2012
Sold by
Cheng Garland and Cheng Rebecca Mei Han
Bought by
Cheng Garland and Cheng Rebecca Mei Han
Home Financials for this Owner
Home Financials are based on the most recent Mortgage that was taken out on this home.
Original Mortgage
$269,000
Outstanding Balance
$186,301
Interest Rate
3.74%
Mortgage Type
New Conventional
Estimated Equity
$725,557
Purchase Details
Closed on
Jul 15, 2011
Sold by
Cheng Garland and Cheng Rebecca
Bought by
Cheng Garland and Cheng Rebecca Mei Han
Purchase Details
Closed on
Jan 16, 2009
Sold by
Us Bank National Association
Bought by
Cheng Garland and Cheng Rebecca
Home Financials for this Owner
Home Financials are based on the most recent Mortgage that was taken out on this home.
Original Mortgage
$280,000
Interest Rate
5.14%
Mortgage Type
Purchase Money Mortgage
Purchase Details
Closed on
Oct 21, 2008
Sold by
Perez Rosa I
Bought by
Us Bank National Association
Purchase Details
Closed on
Jan 24, 2006
Sold by
Shaw Robert A
Bought by
Perez Rosa I
Home Financials for this Owner
Home Financials are based on the most recent Mortgage that was taken out on this home.
Original Mortgage
$476,000
Interest Rate
1.25%
Mortgage Type
Negative Amortization
Purchase Details
Closed on
Oct 5, 2004
Sold by
Shaw Robert A
Bought by
Shaw Robert A
Home Financials for this Owner
Home Financials are based on the most recent Mortgage that was taken out on this home.
Original Mortgage
$360,000
Interest Rate
3.25%
Mortgage Type
New Conventional
Purchase Details
Closed on
May 5, 2003
Sold by
Shaw Robert A
Bought by
Shaw Robert A
Home Financials for this Owner
Home Financials are based on the most recent Mortgage that was taken out on this home.
Original Mortgage
$35,000
Interest Rate
5.84%
Mortgage Type
Credit Line Revolving
Purchase Details
Closed on
Apr 17, 2001
Sold by
Farrow William H
Bought by
Shaw Robert A and Shaw Kelly M
Home Financials for this Owner
Home Financials are based on the most recent Mortgage that was taken out on this home.
Original Mortgage
$265,905
Interest Rate
6.89%
Purchase Details
Closed on
May 24, 2000
Sold by
Fieldstone Communities Inc
Bought by
Farrow William H
Home Financials for this Owner
Home Financials are based on the most recent Mortgage that was taken out on this home.
Original Mortgage
$236,600
Interest Rate
8.67%
Create a Home Valuation Report for This Property
The Home Valuation Report is an in-depth analysis detailing your home's value as well as a comparison with similar homes in the area
Home Values in the Area
Average Home Value in this Area
Purchase History
| Date | Buyer | Sale Price | Title Company |
|---|---|---|---|
| Chan Cheng Garland | -- | None Available | |
| Cheng Garland | -- | Fidelity | |
| Cheng Garland | -- | None Available | |
| Cheng Garland | $350,000 | First American Title Company | |
| Us Bank National Association | $369,000 | Accommodation | |
| Perez Rosa I | $595,000 | New Century Title | |
| Shaw Robert A | -- | Equity Title Co Santa Ana | |
| Shaw Robert A | -- | Fidelity | |
| Shaw Robert A | $280,000 | First American Title | |
| Farrow William H | $244,500 | First American Title Ins Co |
Source: Public Records
Mortgage History
| Date | Status | Borrower | Loan Amount |
|---|---|---|---|
| Open | Cheng Garland | $269,000 | |
| Closed | Cheng Garland | $280,000 | |
| Previous Owner | Perez Rosa I | $476,000 | |
| Previous Owner | Shaw Robert A | $360,000 | |
| Previous Owner | Shaw Robert A | $35,000 | |
| Previous Owner | Shaw Robert A | $265,905 | |
| Previous Owner | Farrow William H | $236,600 |
Source: Public Records
Tax History Compared to Growth
Tax History
| Year | Tax Paid | Tax Assessment Tax Assessment Total Assessment is a certain percentage of the fair market value that is determined by local assessors to be the total taxable value of land and additions on the property. | Land | Improvement |
|---|---|---|---|---|
| 2025 | $6,262 | $450,719 | $157,109 | $293,610 |
| 2024 | $6,262 | $441,881 | $154,028 | $287,853 |
| 2023 | $6,112 | $433,217 | $151,008 | $282,209 |
| 2022 | $6,028 | $424,722 | $148,047 | $276,675 |
| 2021 | $5,933 | $416,394 | $145,144 | $271,250 |
| 2020 | $5,873 | $412,125 | $143,656 | $268,469 |
| 2019 | $5,747 | $404,044 | $140,839 | $263,205 |
| 2018 | $5,737 | $396,121 | $138,077 | $258,044 |
| 2017 | $5,519 | $388,354 | $135,370 | $252,984 |
| 2016 | $5,388 | $380,740 | $132,716 | $248,024 |
| 2015 | $5,349 | $375,020 | $130,722 | $244,298 |
| 2014 | $5,232 | $367,674 | $128,161 | $239,513 |
Source: Public Records
Map
Nearby Homes
- 6530 Catania Place
- 11839 Antler Peak Ct
- 11855 Modena Dr
- 6419 Panorama Ct
- 6701 Marsala Place
- 11571 Pinnacle Peak Ct
- 11530 Marcello Way
- 6393 Kettle Peak Place
- 11537 Mount Hood Ct
- 6872 Landriano Place
- 6988 Edinburgh Place
- 11344 Sunrise Ct
- 11376 Starlight Dr
- 11948 Stegmeir Dr
- 6999 Canosa Place
- 7070 Pozallo Place
- 12164 Wembley Ct
- 12331 Dove Tree Dr
- 7139 Scalea Place
- 12356 Thistle Dr
- 6535 Montecarlo Place
- 6549 Montecarlo Place
- 6538 Veneto Place
- 6546 Veneto Place
- 6530 Veneto Place
- 6559 Montecarlo Place
- 6527 Montecarlo Place
- 6550 Veneto Place
- 11881 Asti Dr
- 6552 Montecarlo Place
- 6526 Veneto Place
- 6563 Montecarlo Place
- 11892 Asti Dr
- 6560 Veneto Place
- 6556 Montecarlo Place
- 11888 Asti Dr
- 11877 Asti Dr
- 6522 Veneto Place
- 6575 Montecarlo Place
- 11880 Asti Dr