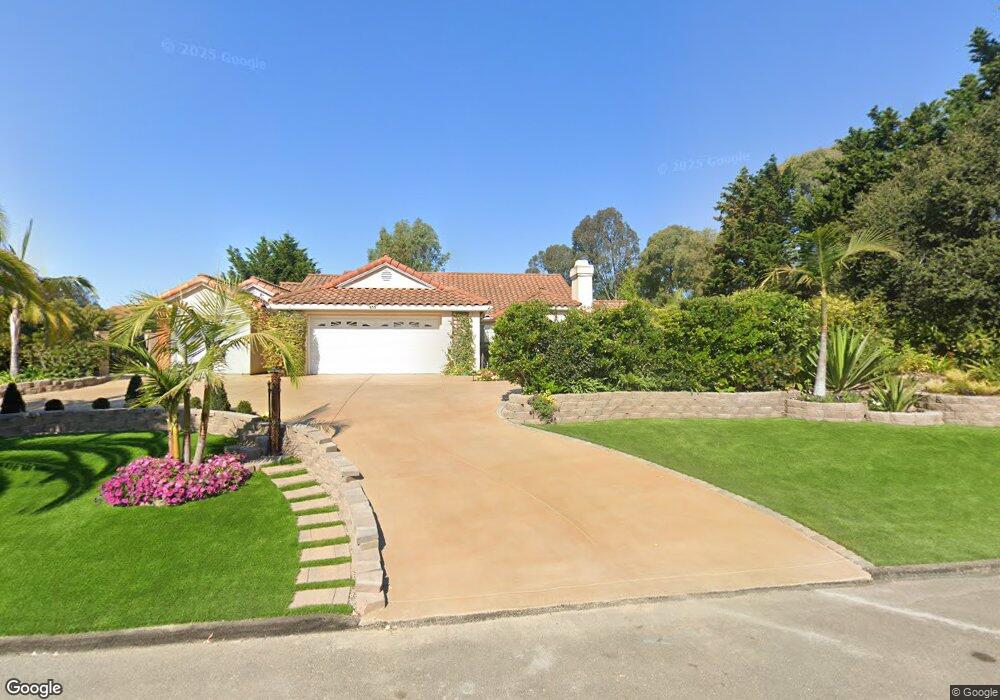
655 Black Ridge Ln Nipomo, CA 93444
Blacklake NeighborhoodEstimated Value: $908,000 - $1,084,568
4
Beds
2
Baths
1,900
Sq Ft
$508/Sq Ft
Est. Value
About This Home
This home is located at 655 Black Ridge Ln, Nipomo, CA 93444 and is currently estimated at $965,392, approximately $508 per square foot. 655 Black Ridge Ln is a home located in San Luis Obispo County with nearby schools including Dorothea Lange Elementary School, Mesa Middle School, and Nipomo High School.
Ownership History
Date
Name
Owned For
Owner Type
Purchase Details
Closed on
May 28, 2019
Sold by
The Forney Living Trust
Bought by
Goff Allan J and Goff Patricia F
Current Estimated Value
Purchase Details
Closed on
Jul 20, 2017
Sold by
Forney Jackson L
Bought by
Forney Jackson L and The Forney Living Trust
Purchase Details
Closed on
Jan 15, 1999
Sold by
Goff Allan J and Goff Patricia E
Bought by
Forney Jackson L and Forney Judith A
Home Financials for this Owner
Home Financials are based on the most recent Mortgage that was taken out on this home.
Original Mortgage
$130,000
Interest Rate
6.77%
Purchase Details
Closed on
Apr 20, 1995
Sold by
Gentry O H O and Gentry Marjorie G
Bought by
Goff Allan J and Goff Patricia E
Home Financials for this Owner
Home Financials are based on the most recent Mortgage that was taken out on this home.
Original Mortgage
$123,500
Interest Rate
8.46%
Mortgage Type
Seller Take Back
Purchase Details
Closed on
Feb 15, 1994
Sold by
Gentry Blake M
Bought by
Gentry O H and Gentry Marjorie G
Create a Home Valuation Report for This Property
The Home Valuation Report is an in-depth analysis detailing your home's value as well as a comparison with similar homes in the area
Home Values in the Area
Average Home Value in this Area
Purchase History
| Date | Buyer | Sale Price | Title Company |
|---|---|---|---|
| Goff Allan J | $585,000 | First American Title Souther | |
| Forney Jackson L | -- | None Available | |
| Forney Jackson L | $255,000 | Chicago Title Co | |
| Goff Allan J | $223,500 | First American Title | |
| Gentry O H | $30,000 | -- |
Source: Public Records
Mortgage History
| Date | Status | Borrower | Loan Amount |
|---|---|---|---|
| Previous Owner | Forney Jackson L | $130,000 | |
| Previous Owner | Goff Allan J | $123,500 |
Source: Public Records
Tax History Compared to Growth
Tax History
| Year | Tax Paid | Tax Assessment Tax Assessment Total Assessment is a certain percentage of the fair market value that is determined by local assessors to be the total taxable value of land and additions on the property. | Land | Improvement |
|---|---|---|---|---|
| 2025 | $7,827 | $652,575 | $216,409 | $436,166 |
| 2024 | $7,757 | $639,780 | $212,166 | $427,614 |
| 2023 | $7,757 | $627,236 | $208,006 | $419,230 |
| 2022 | $7,667 | $614,938 | $203,928 | $411,010 |
| 2021 | $6,575 | $602,881 | $199,930 | $402,951 |
| 2020 | $6,501 | $596,700 | $197,880 | $398,820 |
| 2019 | $5,069 | $464,931 | $154,579 | $310,352 |
| 2018 | $5,008 | $455,816 | $151,549 | $304,267 |
| 2017 | $4,907 | $446,879 | $148,578 | $298,301 |
| 2016 | $4,630 | $438,117 | $145,665 | $292,452 |
| 2015 | $4,563 | $431,537 | $143,477 | $288,060 |
| 2014 | -- | $423,085 | $140,667 | $282,418 |
Source: Public Records
Map
Nearby Homes
- 639 Barberry Way
- 1337 Black Sage Cir
- 1150 Redberry Place
- 1060 Dawn Rd
- 1225 Dawn Rd
- 940 Calle Fresa
- 1276 Pomeroy Rd
- 1024 Maggie Ln
- 1354 Trail View Place
- 1084 Emma Ln
- 961 Jacqueline Place
- 462 Camino Perillo
- 977 Jacqueline Place
- 1790 Calle Laguna
- 1441 Vicki Ln
- 808 Albert Way
- 708 Albert Way
- 1539 Vista Tesoro Place
- 1255 Viva Way
- 1147 Vaquero Way
- 665 Black Ridge Ln
- 650 Black Ridge Ln
- 675 Black Ridge Ln
- 660 Black Ridge Ln
- 640 Black Ridge Ln
- 685 Black Ridge Ln
- 670 Black Ridge Ln
- 635 Black Ridge Ln
- 680 Black Ridge Ln
- 690 Black Ridge Ln
- 1258 Black Sage Cir
- 1254 Black Sage Cir
- 1250 Black Sage Cir
- 630 Black Ridge Ln
- 1248 Black Sage Cir
- 1264 Black Sage Cir
- 1244 Black Sage Cir
- 685 Shelter Ridge Place
- 1250 Willow Rd