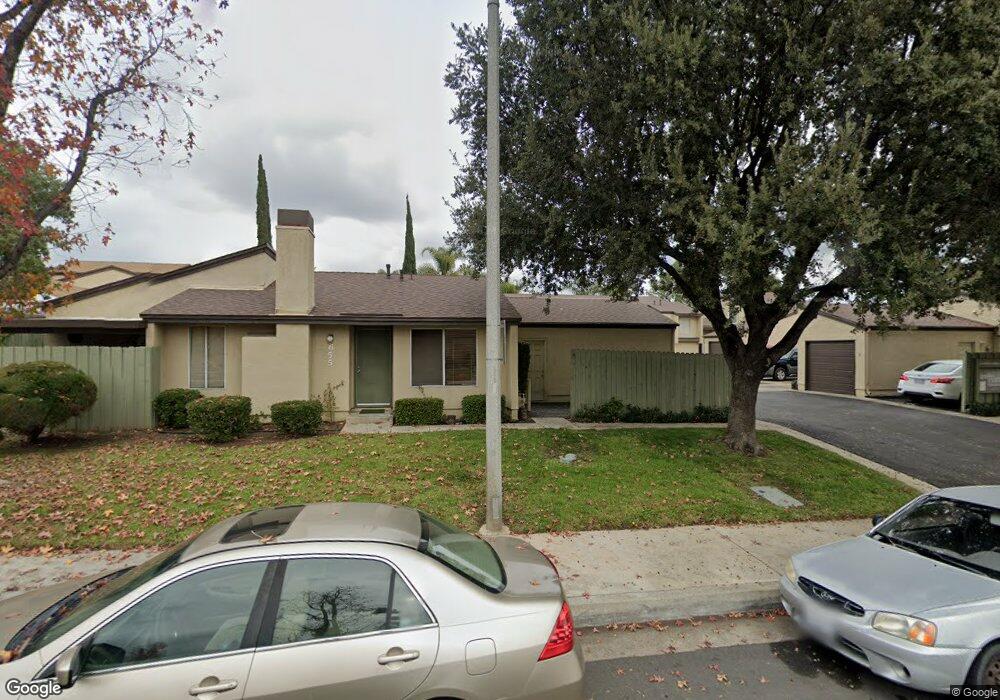
655 Parkview Dr Lake Elsinore, CA 92530
Lake View District NeighborhoodEstimated Value: $255,491 - $296,000
1
Bed
1
Bath
770
Sq Ft
$369/Sq Ft
Est. Value
About This Home
This home is located at 655 Parkview Dr, Lake Elsinore, CA 92530 and is currently estimated at $283,873, approximately $368 per square foot. 655 Parkview Dr is a home located in Riverside County with nearby schools including Machado Elementary School, Terra Cotta Middle School, and Lakeside High School.
Ownership History
Date
Name
Owned For
Owner Type
Purchase Details
Closed on
Feb 21, 2008
Sold by
Suber Timothy John
Bought by
Suber Timothy John and Suber Angela
Current Estimated Value
Purchase Details
Closed on
Oct 18, 2007
Sold by
Suber Angela
Bought by
Suber Timothy John
Purchase Details
Closed on
May 19, 1998
Sold by
Hud
Bought by
Suber Timothy
Home Financials for this Owner
Home Financials are based on the most recent Mortgage that was taken out on this home.
Original Mortgage
$14,950
Interest Rate
6.93%
Purchase Details
Closed on
Apr 25, 1997
Sold by
Gmac Mtg Corp
Bought by
Hud
Purchase Details
Closed on
Apr 24, 1997
Sold by
Hawley Dwaine A
Bought by
Gmac Mtg Corp and Gmac Mtg Corp Of Pa
Purchase Details
Closed on
Sep 20, 1995
Sold by
Coleman Chris and Coleman Maria
Bought by
Montgomery Timothy P
Create a Home Valuation Report for This Property
The Home Valuation Report is an in-depth analysis detailing your home's value as well as a comparison with similar homes in the area
Home Values in the Area
Average Home Value in this Area
Purchase History
| Date | Buyer | Sale Price | Title Company |
|---|---|---|---|
| Suber Timothy John | -- | None Available | |
| Suber Timothy John | -- | Ticor Title Company | |
| Suber Timothy John | -- | Ticor Title Company | |
| Suber Timothy | $23,000 | Commonwealth Land Title Co | |
| Hud | -- | First American Title Ins Co | |
| Gmac Mtg Corp | $45,898 | First American Title Ins Co | |
| Montgomery Timothy P | -- | -- |
Source: Public Records
Mortgage History
| Date | Status | Borrower | Loan Amount |
|---|---|---|---|
| Previous Owner | Suber Timothy | $14,950 |
Source: Public Records
Tax History Compared to Growth
Tax History
| Year | Tax Paid | Tax Assessment Tax Assessment Total Assessment is a certain percentage of the fair market value that is determined by local assessors to be the total taxable value of land and additions on the property. | Land | Improvement |
|---|---|---|---|---|
| 2025 | $534 | $46,996 | $15,658 | $31,338 |
| 2023 | $534 | $45,172 | $15,050 | $30,122 |
| 2022 | $518 | $44,287 | $14,755 | $29,532 |
| 2021 | $509 | $43,419 | $14,466 | $28,953 |
| 2020 | $505 | $42,975 | $14,318 | $28,657 |
| 2019 | $496 | $42,134 | $14,038 | $28,096 |
| 2018 | $487 | $41,309 | $13,764 | $27,545 |
| 2017 | $479 | $40,500 | $13,495 | $27,005 |
| 2016 | $463 | $39,707 | $13,231 | $26,476 |
| 2015 | $459 | $39,112 | $13,033 | $26,079 |
| 2014 | $442 | $38,348 | $12,779 | $25,569 |
Source: Public Records
Map
Nearby Homes
- 632 Parkview Dr
- 593 Parkview Dr
- 596 Parkview Dr
- 684 Parkview Dr
- 713 Walnut Dr Unit 17
- 31750 Machado St Unit 15
- 31750 Machado St Unit 7
- 30980 Olas Ct
- 30991 Olas Ct
- 30987 Olas Ct
- 16395 Broadway St
- 30999 Olas Ct
- 31000 Olas Ct
- 30995 Olas Ct
- 30996 Olas Ct
- 31008 Olas Ct
- Residence 2009 Plan at Laguna Pointe
- Residence 1900 Plan at Laguna Pointe
- Residence 1807 Plan at Laguna Pointe
- Residence 1907 Plan at Laguna Pointe
- 641 Parkview Dr Unit H
- 649 Parkview Dr
- 651 Parkview Dr Unit E
- 651 Parkview Dr
- 647 Parkview Dr Unit E
- 643 Parkview Dr
- 653 Parkview Dr
- 639 Parkview Dr
- 660 Woodcrest Dr
- 654 Woodcrest Dr
- 633 Parkview Dr
- 656 Woodcrest Dr
- 625 Parkview Dr
- 665 Parkview Dr Unit D
- 666 Woodcrest Dr
- 629 Parkview Dr
- 637 Parkview Dr Unit B
- 659 Parkview Dr
- 663 Parkview Dr
- 661 Parkview Dr