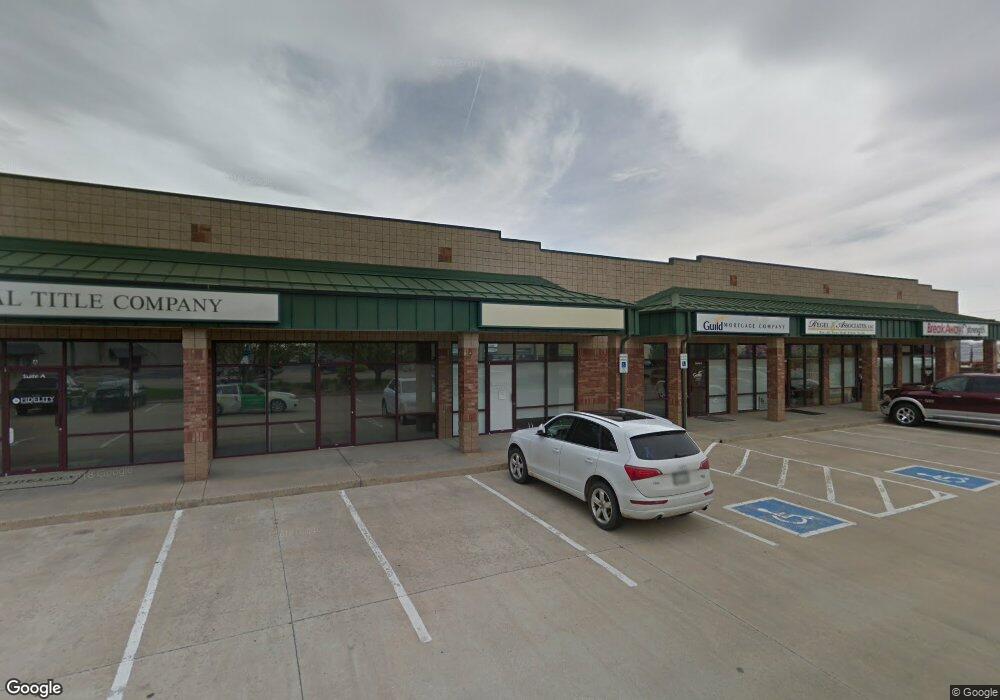
655 S Sunset St Unit A Longmont, CO 80501
Estimated Value: $1,615,849
Studio
--
Bath
9,600
Sq Ft
$168/Sq Ft
Est. Value
About This Home
This home is located at 655 S Sunset St Unit A, Longmont, CO 80501 and is currently estimated at $1,615,849, approximately $168 per square foot. 655 S Sunset St Unit A is a home located in Boulder County with nearby schools including Indian Peaks Elementary School, Sunset Middle School, and Niwot High School.
Ownership History
Date
Name
Owned For
Owner Type
Purchase Details
Closed on
Nov 3, 2016
Sold by
Longmont Housing Authority
Bought by
Suites Apartments Lllp
Current Estimated Value
Home Financials for this Owner
Home Financials are based on the most recent Mortgage that was taken out on this home.
Original Mortgage
$395,000
Outstanding Balance
$317,715
Interest Rate
3.48%
Mortgage Type
Unknown
Estimated Equity
$1,298,134
Purchase Details
Closed on
Nov 23, 2010
Sold by
Macy David
Bought by
Sunset Plaza Llc
Purchase Details
Closed on
Aug 3, 1999
Sold by
1031P Land Corp
Bought by
Macy David
Purchase Details
Closed on
Mar 19, 1998
Sold by
1031 & P Land Corp
Bought by
Macy David
Purchase Details
Closed on
Dec 15, 1997
Sold by
Sunset Business Park Llc
Bought by
1031 & P Land Corp
Create a Home Valuation Report for This Property
The Home Valuation Report is an in-depth analysis detailing your home's value as well as a comparison with similar homes in the area
Purchase History
| Date | Buyer | Sale Price | Title Company |
|---|---|---|---|
| Suites Apartments Lllp | -- | Land Title Guarantee | |
| Sunset Plaza Llc | -- | None Available | |
| Macy David | $437,614 | -- | |
| Macy David | $422,500 | -- | |
| 1031 & P Land Corp | $137,882 | -- |
Source: Public Records
Mortgage History
| Date | Status | Borrower | Loan Amount |
|---|---|---|---|
| Open | Suites Apartments Lllp | $395,000 |
Source: Public Records
Tax History
| Year | Tax Paid | Tax Assessment Tax Assessment Total Assessment is a certain percentage of the fair market value that is determined by local assessors to be the total taxable value of land and additions on the property. | Land | Improvement |
|---|---|---|---|---|
| 2025 | $45,903 | $453,195 | $159,759 | $293,436 |
| 2024 | $45,903 | $453,195 | $159,759 | $293,436 |
| 2023 | $45,277 | $479,880 | $146,475 | $341,775 |
| 2022 | $35,909 | $362,877 | $53,650 | $309,227 |
| 2021 | $35,357 | $362,877 | $53,650 | $309,227 |
| 2020 | $32,171 | $331,180 | $53,650 | $277,530 |
| 2019 | $31,663 | $331,180 | $53,650 | $277,530 |
| 2018 | $31,726 | $334,004 | $102,709 | $231,295 |
| 2017 | $31,295 | $334,004 | $102,709 | $231,295 |
| 2016 | $28,457 | $297,711 | $89,313 | $208,398 |
| 2015 | $27,118 | $265,814 | $62,843 | $202,971 |
| 2014 | $24,828 | $265,814 | $62,843 | $202,971 |
Source: Public Records
Map
Nearby Homes
- 1209 Bistre St
- 1211 Bistre St
- 430 Barnard Ct Unit 72
- 316 Barnard Ct Unit 87
- 832 S Bowen St
- 304 Barnard Ct
- 912 S Bross St
- 818 S Terry St Unit T90
- 1010 S Terry St
- 1432 S Bowen St
- 1618 Donovan Place
- 846 Quebec Ave
- 8 Elizabeth Ct
- 150 Donovan Ct
- 1518 Green Place
- 11 James Cir
- 120 Bowen St
- 1214 S Pratt Pkwy
- 1805 S Pratt Pkwy
- 2858 Bear Springs Cir
- 655 S Sunset St Unit G
- 655 S Sunset St
- 655 S Sunset St Unit D
- 655 S Sunset St Unit E
- 655 S Sunset St Unit ABC
- 630 S Sunset St
- 628 S Sunset St
- 665 Frontage Rd
- 626 S Sunset St
- 618 S Sunset St
- 645 Frontage Rd Unit 2E
- 1819 Nelson Rd
- 600 S Sunset St
- 1507 Nelson Rd
- 1820 Industrial Cir Unit B
- 1820 Industrial Cir Unit C
- 1820 Industrial Cir
- 1925 Nelson Rd
- 1420 Nelson Rd
- 1500 Kansas Ave Unit 4A & 4B
Your Personal Tour Guide
Ask me questions while you tour the home.