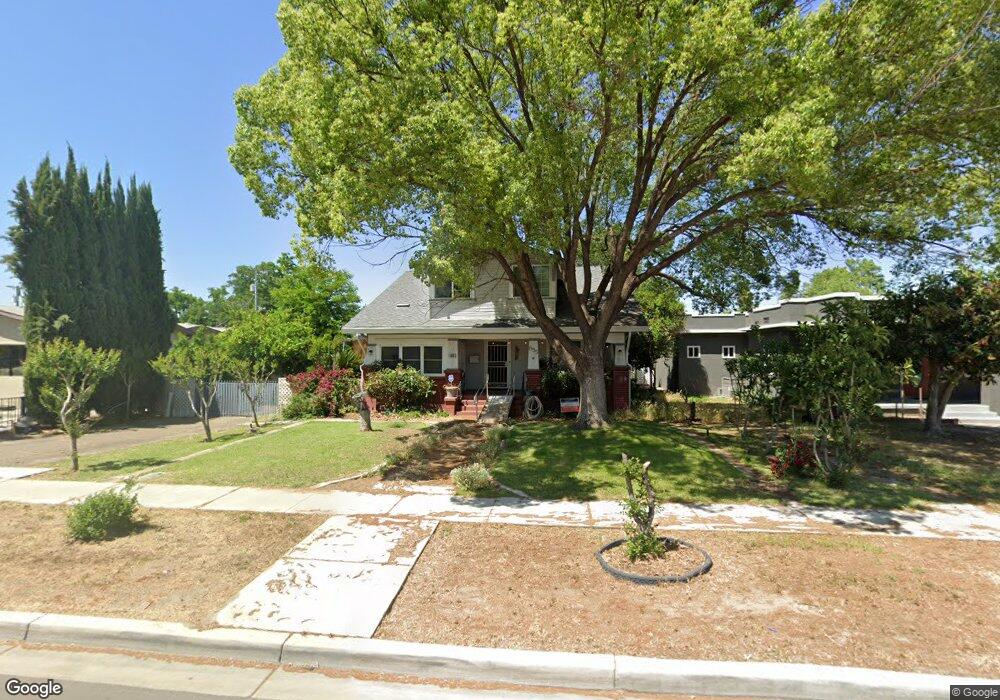
655 W Main St Turlock, CA 95380
Downtown Turlock NeighborhoodEstimated Value: $439,000 - $675,000
6
Beds
2
Baths
3,167
Sq Ft
$187/Sq Ft
Est. Value
About This Home
This home is located at 655 W Main St, Turlock, CA 95380 and is currently estimated at $593,205, approximately $187 per square foot. 655 W Main St is a home located in Stanislaus County with nearby schools including Wakefield Elementary School, Marvin A. Dutcher Middle School, and Turlock Junior High School.
Ownership History
Date
Name
Owned For
Owner Type
Purchase Details
Closed on
Jan 12, 2022
Sold by
Esquer Gil N and Esquer Rosa
Bought by
Esquer Family 2022 Revocable Trust
Current Estimated Value
Purchase Details
Closed on
Oct 20, 2006
Sold by
Martins Manuel and Martins Connie
Bought by
Esquer Gil N and Esquer Rosa
Home Financials for this Owner
Home Financials are based on the most recent Mortgage that was taken out on this home.
Original Mortgage
$320,000
Interest Rate
6.36%
Mortgage Type
Purchase Money Mortgage
Create a Home Valuation Report for This Property
The Home Valuation Report is an in-depth analysis detailing your home's value as well as a comparison with similar homes in the area
Home Values in the Area
Average Home Value in this Area
Purchase History
| Date | Buyer | Sale Price | Title Company |
|---|---|---|---|
| Esquer Family 2022 Revocable Trust | -- | Hillberg Ronald W | |
| Esquer Gil N | $400,000 | Fidelity Natl Title Co Of Ca |
Source: Public Records
Mortgage History
| Date | Status | Borrower | Loan Amount |
|---|---|---|---|
| Previous Owner | Esquer Gil N | $320,000 |
Source: Public Records
Map
Nearby Homes
- 545 W Main St
- 591 High St
- 526 Flower St
- 350 West Ave N
- 374 W Main St
- 350 West Ave S
- 830 Flower St
- 801 Flower St
- 250 Davis St
- 312 W Main St
- 556 Vermont Ave
- 541 Justin Dr
- 230 Vermont Ave
- 531 Justin Dr
- 1065 Vermont Ave
- 243 Angelus St
- 900 W Canal Dr Unit 100
- 900 W Canal Dr Unit 114
- 1270 Magic Sands Way
- 808 West Ave S
Your Personal Tour Guide
Ask me questions while you tour the home.