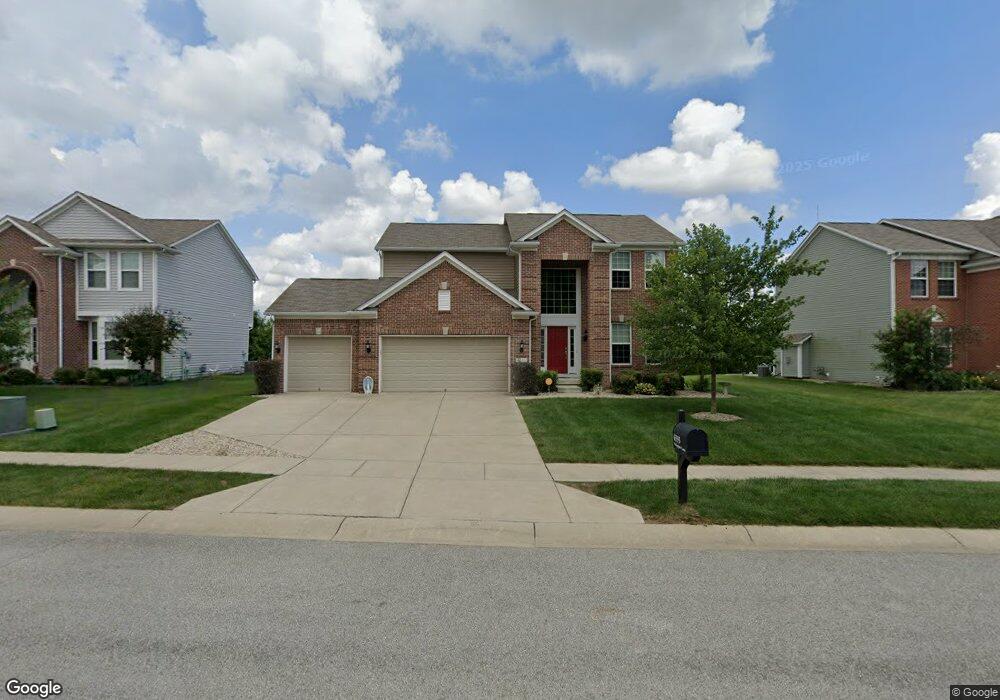
6555 Wedgeport Ln Indianapolis, IN 46259
Galludet NeighborhoodEstimated Value: $409,000 - $471,000
4
Beds
3
Baths
3,104
Sq Ft
$142/Sq Ft
Est. Value
About This Home
This home is located at 6555 Wedgeport Ln, Indianapolis, IN 46259 and is currently estimated at $440,222, approximately $141 per square foot. 6555 Wedgeport Ln is a home located in Marion County with nearby schools including Franklin Central High School.
Ownership History
Date
Name
Owned For
Owner Type
Purchase Details
Closed on
Nov 23, 2011
Sold by
Brookfield Global Relocation Services Ll
Bought by
Underwood Amber and Underwood David
Current Estimated Value
Home Financials for this Owner
Home Financials are based on the most recent Mortgage that was taken out on this home.
Original Mortgage
$204,150
Outstanding Balance
$138,941
Interest Rate
3.98%
Mortgage Type
New Conventional
Estimated Equity
$301,281
Purchase Details
Closed on
Oct 9, 2011
Sold by
Sanders Matthew R
Bought by
Andrew R Drake Atty
Home Financials for this Owner
Home Financials are based on the most recent Mortgage that was taken out on this home.
Original Mortgage
$204,150
Outstanding Balance
$138,941
Interest Rate
3.98%
Mortgage Type
New Conventional
Estimated Equity
$301,281
Purchase Details
Closed on
Oct 1, 2010
Sold by
Pulte Homes Of Indiana Llc
Bought by
Sanders Matthew R and Sanders Cynthia C
Home Financials for this Owner
Home Financials are based on the most recent Mortgage that was taken out on this home.
Original Mortgage
$208,619
Interest Rate
3.3%
Mortgage Type
FHA
Create a Home Valuation Report for This Property
The Home Valuation Report is an in-depth analysis detailing your home's value as well as a comparison with similar homes in the area
Home Values in the Area
Average Home Value in this Area
Purchase History
| Date | Buyer | Sale Price | Title Company |
|---|---|---|---|
| Underwood Amber | -- | None Available | |
| Andrew R Drake Atty | $214,900 | -- | |
| Brookfield Global Relocation Services Ll | -- | None Available | |
| Sanders Matthew R | -- | None Available |
Source: Public Records
Mortgage History
| Date | Status | Borrower | Loan Amount |
|---|---|---|---|
| Open | Underwood Amber | $204,150 | |
| Previous Owner | Sanders Matthew R | $208,619 |
Source: Public Records
Tax History Compared to Growth
Tax History
| Year | Tax Paid | Tax Assessment Tax Assessment Total Assessment is a certain percentage of the fair market value that is determined by local assessors to be the total taxable value of land and additions on the property. | Land | Improvement |
|---|---|---|---|---|
| 2024 | $3,534 | $368,300 | $56,100 | $312,200 |
| 2023 | $3,534 | $342,800 | $56,100 | $286,700 |
| 2022 | $3,473 | $333,700 | $56,100 | $277,600 |
| 2021 | $3,010 | $290,800 | $56,100 | $234,700 |
| 2020 | $2,880 | $278,100 | $56,100 | $222,000 |
| 2019 | $2,676 | $257,900 | $52,500 | $205,400 |
| 2018 | $2,608 | $251,400 | $52,500 | $198,900 |
| 2017 | $2,556 | $246,400 | $52,500 | $193,900 |
| 2016 | $2,487 | $239,700 | $52,500 | $187,200 |
| 2014 | $2,400 | $240,000 | $52,500 | $187,500 |
| 2013 | $2,277 | $227,700 | $52,500 | $175,200 |
Source: Public Records
Map
Nearby Homes
- 7350 Gold King Way
- 6641 Trail Ridge Way
- 6651 Trail Ridge Way
- 6336 Moonstruck Pkwy
- 7414 Glen Park Way
- 7048 Milano Dr
- 6408 Askin Dr
- 6553 Stone Pointe Way
- 6144 Moon Shadow Dr
- 6038 Easy Ln
- 6904 Amber Springs Way
- 6303 Amber Valley Ln
- 6411 Nightshade Dr
- 7093 Republic Ln
- 7102 Franklin Parke Blvd
- 7046 Allegiance Ct
- 7168 Franklin Parke Blvd
- 7132 Birch Leaf Dr
- 7411 Preamble Ct
- 7008 Myra Way
- 6563 Wedgeport Ln
- 6547 Wedgeport Ln
- 6539 Wedgeport Ln
- 6605 Wedgeport Ln
- 6554 Wedgeport Ln
- 6546 Wedgeport Ln
- 6536 Wedgeport Ln
- 6562 Wedgeport Ln
- 6531 Wedgeport Ln
- 6615 Wedgeport Ln
- 6606 Wedgeport Ln
- 6525 Wedgeport Ln
- 6623 Wedgeport Ln
- 7351 Snowbird Way
- 7342 Gold King Way
- 7341 Snowbird Way
- 7334 Gold King Way
- 6631 Marble Arch Way
- 7350 Snowbird Way
- 6639 Marble Arch Way