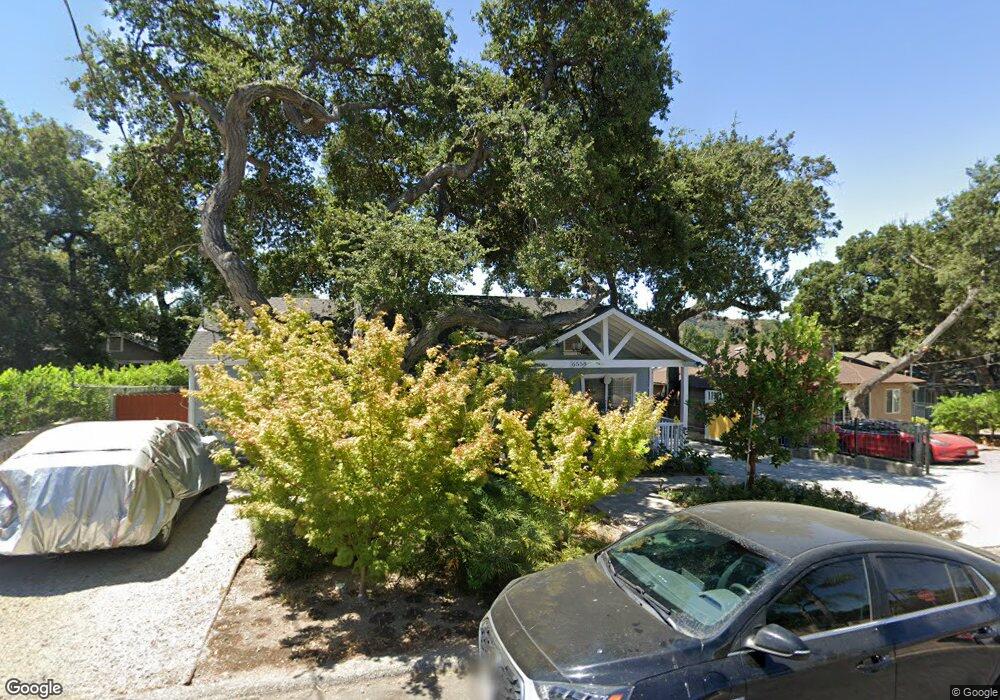
6558 Olcott St Tujunga, CA 91042
Estimated Value: $724,000 - $819,969
3
Beds
1
Bath
948
Sq Ft
$814/Sq Ft
Est. Value
About This Home
This home is located at 6558 Olcott St, Tujunga, CA 91042 and is currently estimated at $771,242, approximately $813 per square foot. 6558 Olcott St is a home located in Los Angeles County with nearby schools including Mountain View Elementary School, Mt. Gleason Middle School, and Verdugo Hills Senior High School.
Ownership History
Date
Name
Owned For
Owner Type
Purchase Details
Closed on
Oct 8, 2022
Sold by
Ryan Damian W and Ryan Rachel S
Bought by
Damian W Ryan And Rachel Ryan Family Trust and Ryan
Current Estimated Value
Purchase Details
Closed on
Feb 14, 2003
Sold by
Shelton Katherine F
Bought by
Jourdan Charles T
Home Financials for this Owner
Home Financials are based on the most recent Mortgage that was taken out on this home.
Original Mortgage
$158,000
Interest Rate
5.84%
Create a Home Valuation Report for This Property
The Home Valuation Report is an in-depth analysis detailing your home's value as well as a comparison with similar homes in the area
Home Values in the Area
Average Home Value in this Area
Purchase History
| Date | Buyer | Sale Price | Title Company |
|---|---|---|---|
| Damian W Ryan And Rachel Ryan Family Trust | -- | None Listed On Document | |
| Jourdan Charles T | $220,000 | Chicago Title Co |
Source: Public Records
Mortgage History
| Date | Status | Borrower | Loan Amount |
|---|---|---|---|
| Previous Owner | Jourdan Charles T | $158,000 | |
| Closed | Jourdan Charles T | $15,000 |
Source: Public Records
Tax History
| Year | Tax Paid | Tax Assessment Tax Assessment Total Assessment is a certain percentage of the fair market value that is determined by local assessors to be the total taxable value of land and additions on the property. | Land | Improvement |
|---|---|---|---|---|
| 2025 | $8,792 | $719,815 | $503,330 | $216,485 |
| 2024 | $8,659 | $705,702 | $493,461 | $212,241 |
| 2023 | $8,491 | $691,866 | $483,786 | $208,080 |
| 2022 | $8,093 | $678,300 | $474,300 | $204,000 |
| 2021 | $7,995 | $665,000 | $465,000 | $200,000 |
| 2020 | $3,590 | $291,331 | $233,071 | $58,260 |
| 2019 | $3,449 | $285,619 | $228,501 | $57,118 |
| 2018 | $3,417 | $280,020 | $224,021 | $55,999 |
| 2016 | $3,258 | $269,148 | $215,323 | $53,825 |
| 2015 | $3,210 | $265,106 | $212,089 | $53,017 |
| 2014 | $3,228 | $259,914 | $207,935 | $51,979 |
Source: Public Records
Map
Nearby Homes
- 6809 Haywood St
- 6521 Day St
- 6436 Day St
- 6834 Haywood St
- 10157 Durkee Ave
- 9825 Tujunga Canyon Place
- 9722 Tujunga Canyon Blvd
- 0 Flora Morgan Trail
- 9747 Haines Canyon Ave
- 6911 Valmont St
- 0 Blanchard Canyon Unit SR25247538
- 6369 W Sister Elsie Dr
- 7006 Valmont St Unit B
- 10136 Silverton Ave
- 6134 Sister Elsie Dr
- 7025 Day St
- 3953 Santa Carlotta St
- 7049 Sunnycrest Trail
- 4922 Lowell Ave
- 7115 Shadygrove St
Your Personal Tour Guide
Ask me questions while you tour the home.