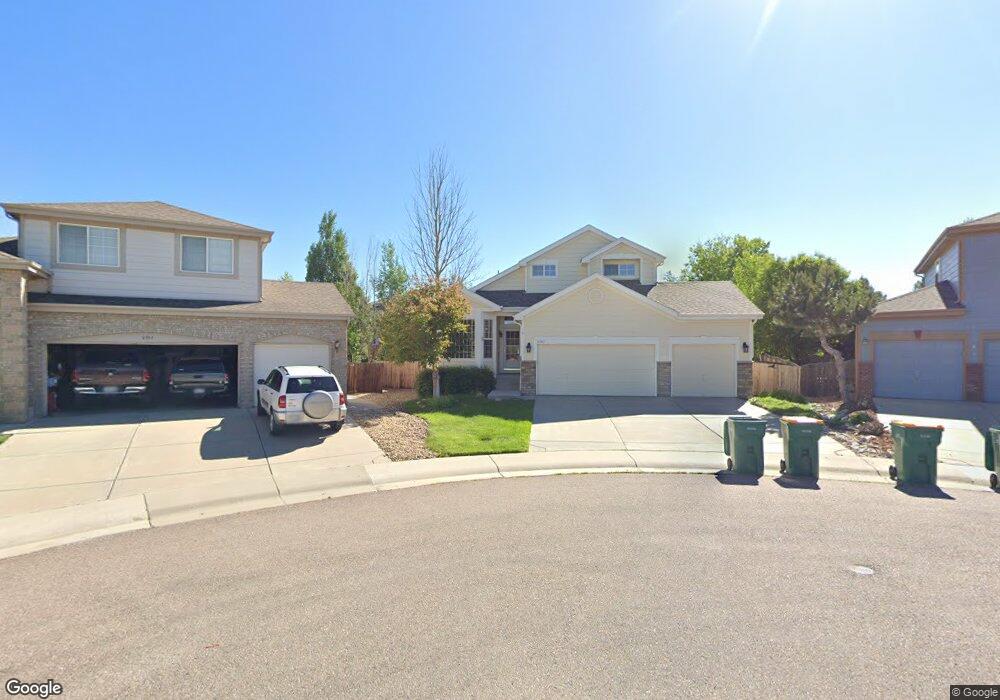
6562 Trappers Trail Ave Parker, CO 80134
The Pinery NeighborhoodEstimated Value: $578,000 - $601,201
3
Beds
3
Baths
2,034
Sq Ft
$290/Sq Ft
Est. Value
About This Home
This home is located at 6562 Trappers Trail Ave, Parker, CO 80134 and is currently estimated at $589,050, approximately $289 per square foot. 6562 Trappers Trail Ave is a home located in Douglas County with nearby schools including Mountain View Elementary School, Northeast Elementary School, and Sagewood Middle School.
Ownership History
Date
Name
Owned For
Owner Type
Purchase Details
Closed on
Feb 25, 2004
Sold by
Felts Angela T
Bought by
Felts Angela T and Felts Donald T
Current Estimated Value
Home Financials for this Owner
Home Financials are based on the most recent Mortgage that was taken out on this home.
Original Mortgage
$216,000
Outstanding Balance
$95,264
Interest Rate
4.87%
Mortgage Type
Unknown
Estimated Equity
$493,786
Purchase Details
Closed on
Sep 27, 2002
Sold by
Kdb Homes Inc
Bought by
Felts Angela T
Home Financials for this Owner
Home Financials are based on the most recent Mortgage that was taken out on this home.
Original Mortgage
$216,340
Interest Rate
4.62%
Purchase Details
Closed on
Jul 30, 1997
Sold by
Community Dev Group Pinery West
Bought by
Kdb Homes Inc
Create a Home Valuation Report for This Property
The Home Valuation Report is an in-depth analysis detailing your home's value as well as a comparison with similar homes in the area
Home Values in the Area
Average Home Value in this Area
Purchase History
| Date | Buyer | Sale Price | Title Company |
|---|---|---|---|
| Felts Angela T | -- | -- | |
| Felts Angela T | $270,436 | First American Heritage Titl | |
| Kdb Homes Inc | $1,930,000 | -- | |
| Community Dev Group Pinery West | -- | -- |
Source: Public Records
Mortgage History
| Date | Status | Borrower | Loan Amount |
|---|---|---|---|
| Open | Felts Angela T | $216,000 | |
| Closed | Felts Angela T | $216,340 | |
| Closed | Felts Angela T | $54,000 |
Source: Public Records
Tax History Compared to Growth
Tax History
| Year | Tax Paid | Tax Assessment Tax Assessment Total Assessment is a certain percentage of the fair market value that is determined by local assessors to be the total taxable value of land and additions on the property. | Land | Improvement |
|---|---|---|---|---|
| 2024 | $3,323 | $41,810 | $10,070 | $31,740 |
| 2023 | $3,360 | $41,810 | $10,070 | $31,740 |
| 2022 | $2,646 | $31,230 | $5,850 | $25,380 |
| 2021 | $2,742 | $31,230 | $5,850 | $25,380 |
| 2020 | $2,579 | $30,060 | $5,450 | $24,610 |
| 2019 | $2,591 | $30,060 | $5,450 | $24,610 |
| 2018 | $2,289 | $26,150 | $5,430 | $20,720 |
| 2017 | $2,868 | $26,150 | $5,430 | $20,720 |
| 2016 | $2,822 | $24,090 | $4,380 | $19,710 |
| 2015 | $2,867 | $24,090 | $4,380 | $19,710 |
| 2014 | $2,578 | $19,670 | $3,820 | $15,850 |
Source: Public Records
Map
Nearby Homes
- 5453 Military Trail
- 6490 Coldwater Dr
- 5657 Pinto Valley St
- 6017 Merchant Place
- 6078 Bridle Path Ln
- 7243 N Hyperion Way
- 5736 Cadara Way
- 7316 Meadow View
- 6228 Dapplegray St
- 7209 N Hyperion Way
- 6340 Verve Ln
- Wegner Plan at Toll Brothers at Cherry Creek Trail
- Breuer Plan at Toll Brothers at Cherry Creek Trail
- Jacobsen Plan at Toll Brothers at Cherry Creek Trail
- Ponti Plan at Toll Brothers at Cherry Creek Trail
- 7351 Meadow View
- 6367 Verve Ln
- 6353 Verve Ln
- 6327 Verve Ln
- 6083 Saddle Bow Ave
- 6563 Trappers Trail Ave
- 6552 Trappers Trail Ave
- 5347 Rhyolite Way
- 5353 Rhyolite Way
- 6542 Trappers Trail Ave
- 6553 Trappers Trail Ave
- 5359 Rhyolite Way
- 6532 Trappers Trail Ave
- 5278 Territorial St
- 5328 Territorial St
- 5268 Territorial St
- 5365 Rhyolite Way
- 5338 Territorial St
- 5340 Rhyolite Way
- 5350 Rhyolite Way
- 5258 Territorial St
- 5348 Territorial St
- 5360 Rhyolite Way
- 5360 Territorial St
- 5303 Territorial St