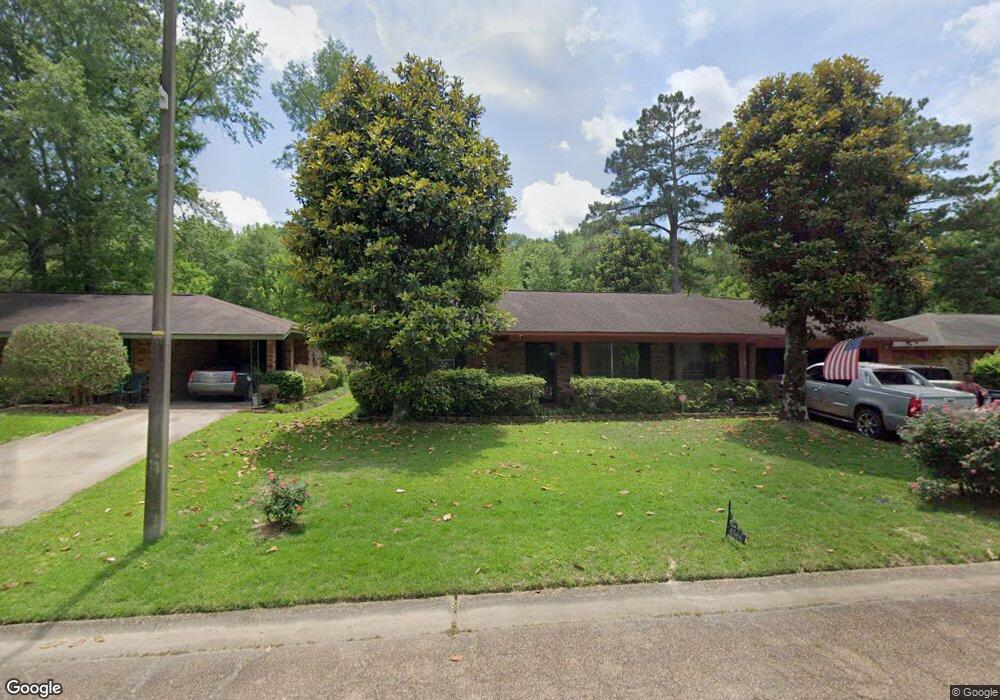
6566 Franklin D Roosevelt Dr Jackson, MS 39213
North Jackson NeighborhoodEstimated Value: $87,416 - $121,000
--
Bed
--
Bath
1,641
Sq Ft
$64/Sq Ft
Est. Value
About This Home
This home is located at 6566 Franklin D Roosevelt Dr, Jackson, MS 39213 and is currently estimated at $105,104, approximately $64 per square foot. 6566 Franklin D Roosevelt Dr is a home located in Hinds County with nearby schools including John Hopkins Elementary School, Powell Middle School, and Provine High School.
Create a Home Valuation Report for This Property
The Home Valuation Report is an in-depth analysis detailing your home's value as well as a comparison with similar homes in the area
Home Values in the Area
Average Home Value in this Area
Tax History Compared to Growth
Tax History
| Year | Tax Paid | Tax Assessment Tax Assessment Total Assessment is a certain percentage of the fair market value that is determined by local assessors to be the total taxable value of land and additions on the property. | Land | Improvement |
|---|---|---|---|---|
| 2025 | $1,155 | $6,006 | $1,500 | $4,506 |
| 2024 | $1,155 | $6,006 | $1,500 | $4,506 |
| 2023 | $1,155 | $6,006 | $1,500 | $4,506 |
| 2022 | $1,156 | $6,006 | $1,500 | $4,506 |
| 2021 | $1,148 | $5,968 | $1,500 | $4,468 |
| 2020 | $1,131 | $5,914 | $1,500 | $4,414 |
| 2019 | $1,132 | $5,914 | $1,500 | $4,414 |
| 2018 | $0 | $5,914 | $1,500 | $4,414 |
| 2017 | $0 | $5,914 | $1,500 | $4,414 |
| 2016 | $0 | $5,914 | $1,500 | $4,414 |
| 2015 | -- | $5,822 | $1,500 | $4,322 |
| 2014 | $807 | $5,822 | $1,500 | $4,322 |
Source: Public Records
Map
Nearby Homes
- 6607 Franklin D Roosevelt Dr
- 0 Trace Dr Dr
- 138 William McKinley Cir
- 6548 George Washington Dr
- 381 James Garfield Cir
- 6634 Lyndon b Johnson Dr
- 3731 John F. Kennedy Blvd
- 0003 Southern Trace Blvd
- 3704 John F. Kennedy Blvd Unit J
- 804 N Flag Chapel Rd
- 685 Queen Cir
- 0 U S 49 Unit 4094302
- 667 Queen Cir
- 0 Castlewood Dr
- 0 Cottonwood Dr
- 0 Red Oak St
- 000 Magnolia Rd
- 525 Magnolia Rd
- 220 Pin Oak Dr
- 506 Lowder Dr
- 6564 Franklin D Roosevelt Dr
- 6568 Franklin D Roosevelt Dr
- 6562 Franklin D Roosevelt Dr
- 6570 Franklin D Roosevelt Dr
- 6569 Franklin Delano Roosevelt Dr
- 6569 Franklin D Roosevelt Dr
- 6565 Franklin D Roosevelt Dr
- 6560 Franklin D Roosevelt Dr
- 6572 Franklin D Roosevelt Dr
- 6571 Franklin Delano Roosevelt Dr
- 6571 Franklin D Roosevelt Dr
- 6563 Franklin D Roosevelt Dr
- 6558 Franklin D Roosevelt Dr
- 6574 Franklin D Roosevelt Dr
- 6559 Franklin D Roosevelt Dr
- 6556 Franklin D Roosevelt Dr
- 6576 Franklin D Roosevelt Dr
- 6554 Franklin D Roosevelt Dr
- 6578 Franklin D Roosevelt Dr
- 6555 Franklin D Roosevelt Dr