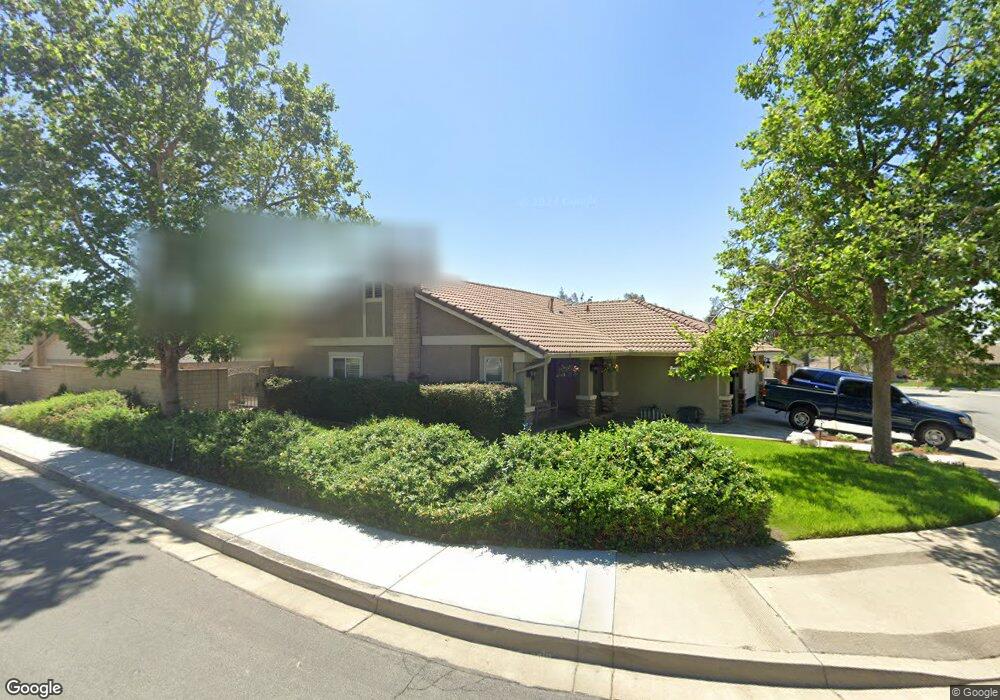
6569 Hazelnut Way Rancho Cucamonga, CA 91739
Victoria NeighborhoodEstimated Value: $700,000 - $787,000
3
Beds
2
Baths
1,408
Sq Ft
$519/Sq Ft
Est. Value
About This Home
This home is located at 6569 Hazelnut Way, Rancho Cucamonga, CA 91739 and is currently estimated at $731,210, approximately $519 per square foot. 6569 Hazelnut Way is a home located in San Bernardino County with nearby schools including Windrows Elementary School, Etiwanda Intermediate, and Rancho Cucamonga High School.
Ownership History
Date
Name
Owned For
Owner Type
Purchase Details
Closed on
Jul 2, 2005
Sold by
Moore Serrann E
Bought by
The Serrann E Moore 2005 Trust
Current Estimated Value
Purchase Details
Closed on
Aug 26, 1998
Sold by
Rutter Hollie Ly
Bought by
Rutter Carl
Home Financials for this Owner
Home Financials are based on the most recent Mortgage that was taken out on this home.
Original Mortgage
$151,182
Outstanding Balance
$30,697
Interest Rate
6.91%
Mortgage Type
FHA
Estimated Equity
$700,513
Purchase Details
Closed on
Jul 21, 1998
Sold by
Rutter Carl
Bought by
Moore Serrann E
Home Financials for this Owner
Home Financials are based on the most recent Mortgage that was taken out on this home.
Original Mortgage
$151,182
Outstanding Balance
$30,697
Interest Rate
6.91%
Mortgage Type
FHA
Estimated Equity
$700,513
Purchase Details
Closed on
Oct 29, 1993
Sold by
Ibison Marshall Dale
Bought by
Rutter Carl
Home Financials for this Owner
Home Financials are based on the most recent Mortgage that was taken out on this home.
Original Mortgage
$112,000
Interest Rate
6.89%
Create a Home Valuation Report for This Property
The Home Valuation Report is an in-depth analysis detailing your home's value as well as a comparison with similar homes in the area
Home Values in the Area
Average Home Value in this Area
Purchase History
| Date | Buyer | Sale Price | Title Company |
|---|---|---|---|
| The Serrann E Moore 2005 Trust | -- | -- | |
| Rutter Carl | -- | North American Title Co | |
| Moore Serrann E | $154,000 | Northern Counties Title | |
| Rutter Carl | $140,000 | Chicago Title Co |
Source: Public Records
Mortgage History
| Date | Status | Borrower | Loan Amount |
|---|---|---|---|
| Open | Moore Serrann E | $151,182 | |
| Previous Owner | Rutter Carl | $112,000 |
Source: Public Records
Tax History Compared to Growth
Tax History
| Year | Tax Paid | Tax Assessment Tax Assessment Total Assessment is a certain percentage of the fair market value that is determined by local assessors to be the total taxable value of land and additions on the property. | Land | Improvement |
|---|---|---|---|---|
| 2025 | $3,364 | $241,276 | $60,357 | $180,919 |
| 2024 | $3,364 | $236,546 | $59,174 | $177,372 |
| 2023 | $3,267 | $231,908 | $58,014 | $173,894 |
| 2022 | $3,204 | $227,360 | $56,876 | $170,484 |
| 2021 | $3,147 | $222,902 | $55,761 | $167,141 |
| 2020 | $3,114 | $220,616 | $55,189 | $165,427 |
| 2019 | $3,047 | $216,290 | $54,107 | $162,183 |
| 2018 | $3,228 | $212,049 | $53,046 | $159,003 |
| 2017 | $2,918 | $207,891 | $52,006 | $155,885 |
| 2016 | $2,841 | $203,814 | $50,986 | $152,828 |
| 2015 | $2,815 | $200,752 | $50,220 | $150,532 |
| 2014 | $2,754 | $196,819 | $49,236 | $147,583 |
Source: Public Records
Map
Nearby Homes
- 12420 Silk Oak Ct
- 12331 Dove Tree Dr
- 12356 Thistle Dr
- 6502 Dogwood Place
- 6732 Plum Way
- 12206 Tunbridge Ct
- 12325 Bellflower Ct
- 6921 Dahlia Ct
- 6822 Foxtail Ct
- 6197 Greenwood Place
- 6992 Fontaine Place
- 6525 Etiwanda Ave
- 6575 Etiwanda Ave
- 12794 Windstar Dr
- 7068 Crocus Ct
- 7077 Iris Place
- 7067 Fontaine Place
- 12164 Wembley Ct
- 12184 Clydesdale Dr
- 13031 Vista St
- 6577 Hazelnut Way
- 6568 Redbud Place
- 6552 Redbud Place
- 6576 Redbud Place
- 12375 Firethorn St
- 6589 Hazelnut Way
- 6553 Myrtle Ct
- 6584 Redbud Place
- 6542 Redbud Place
- 12378 Dove Tree Dr
- 12365 Firethorn St
- 6543 Myrtle Ct
- 6592 Redbud Place
- 12368 Dove Tree Dr
- 6595 Hazelnut Way
- 6532 Redbud Place
- 6547 Redbud Place
- 6559 Redbud Place
- 12355 Firethorn St
- 6567 Redbud Place