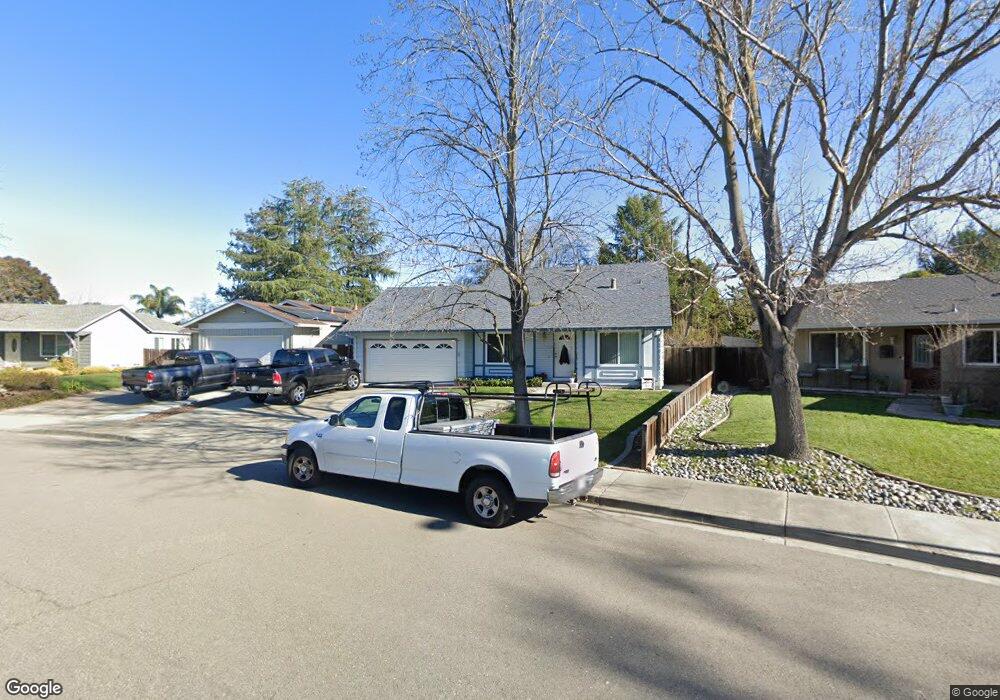
657 Covington Way Livermore, CA 94551
Summerset NeighborhoodEstimated Value: $1,093,000 - $1,241,000
5
Beds
3
Baths
2,124
Sq Ft
$551/Sq Ft
Est. Value
About This Home
This home is located at 657 Covington Way, Livermore, CA 94551 and is currently estimated at $1,169,322, approximately $550 per square foot. 657 Covington Way is a home located in Alameda County with nearby schools including Rancho Las Positas Elementary School, Junction Avenue K-8 School, and Granada High School.
Ownership History
Date
Name
Owned For
Owner Type
Purchase Details
Closed on
Dec 5, 2017
Sold by
Castner James Scott and Castner Jennifer Dawn
Bought by
Castner James Scott and Castner Jennifer Dawn
Current Estimated Value
Home Financials for this Owner
Home Financials are based on the most recent Mortgage that was taken out on this home.
Original Mortgage
$433,218
Interest Rate
3.94%
Mortgage Type
VA
Purchase Details
Closed on
Oct 10, 2012
Sold by
Castner James S and Castner Jennifer D
Bought by
Castner James Scott and Castner Jennifer Dawn
Purchase Details
Closed on
Mar 18, 2003
Sold by
Castner James Scott and Castner Jennifer Dawn
Bought by
Castner James Scott and Castner Jennifer Dawn
Home Financials for this Owner
Home Financials are based on the most recent Mortgage that was taken out on this home.
Original Mortgage
$220,000
Interest Rate
5.79%
Create a Home Valuation Report for This Property
The Home Valuation Report is an in-depth analysis detailing your home's value as well as a comparison with similar homes in the area
Home Values in the Area
Average Home Value in this Area
Purchase History
| Date | Buyer | Sale Price | Title Company |
|---|---|---|---|
| Castner James Scott | -- | Orange Coast Title Co Of Nor | |
| Castner James Scott | -- | Orange Coast Title Co Of Nor | |
| Castner James Scott | -- | None Available | |
| Castner James Scott | -- | Financial Title Company |
Source: Public Records
Mortgage History
| Date | Status | Borrower | Loan Amount |
|---|---|---|---|
| Closed | Castner James Scott | $433,218 | |
| Closed | Castner James Scott | $220,000 |
Source: Public Records
Tax History
| Year | Tax Paid | Tax Assessment Tax Assessment Total Assessment is a certain percentage of the fair market value that is determined by local assessors to be the total taxable value of land and additions on the property. | Land | Improvement |
|---|---|---|---|---|
| 2025 | $3,934 | $250,424 | $59,344 | $191,080 |
| 2024 | $3,934 | $245,514 | $58,181 | $187,333 |
| 2023 | $2,811 | $149,132 | $57,040 | $92,092 |
| 2022 | $2,750 | $146,208 | $55,922 | $90,286 |
| 2021 | $2,680 | $143,341 | $54,825 | $88,516 |
| 2020 | $2,585 | $141,872 | $54,263 | $87,609 |
| 2019 | $2,580 | $139,090 | $53,199 | $85,891 |
| 2018 | $2,505 | $136,363 | $52,156 | $84,207 |
| 2017 | $2,427 | $133,690 | $51,134 | $82,556 |
| 2016 | $2,313 | $131,069 | $50,131 | $80,938 |
| 2015 | $2,183 | $129,100 | $49,378 | $79,722 |
| 2014 | $2,140 | $126,572 | $48,411 | $78,161 |
Source: Public Records
Map
Nearby Homes
- 855 Hanover St
- 552 Hanover St
- 731 Del Norte Dr
- 1240 Via Jose Unit 96
- 1279 Via Jose Unit 106
- 1360 Toulon Ct
- 761 Pine St
- 1363 Rincon Ave
- 849 Dakota Ct
- 1169 Apache St
- 1320 Portola Ave
- 1322 Portola Ave
- 1324 Portola Ave
- 897 Tranquility Cir Unit 12
- 849 Tranquility Cir Unit 3
- 772 Tranquility Cir Unit 2
- 788 Tranquility Cir Unit 2
- 1330 Portola Ave
- 716 Tranquility Cir Unit 1
- 807 Crane Ave
- 597 Covington Way
- 661 Covington Way
- 634 Huntington Way
- 626 Huntington Way
- 583 Covington Way
- 640 Huntington Way
- 679 Covington Way
- 570 Huntington Way
- 588 Covington Way
- 672 Huntington Way
- 558 Huntington Way
- 571 Covington Way
- 576 Covington Way
- 886 Hanover St
- 590 Covington Way
- 874 Hanover St
- 686 Huntington Way
- 544 Huntington Way
- 569 Covington Way
- 862 Hanover St
Your Personal Tour Guide
Ask me questions while you tour the home.