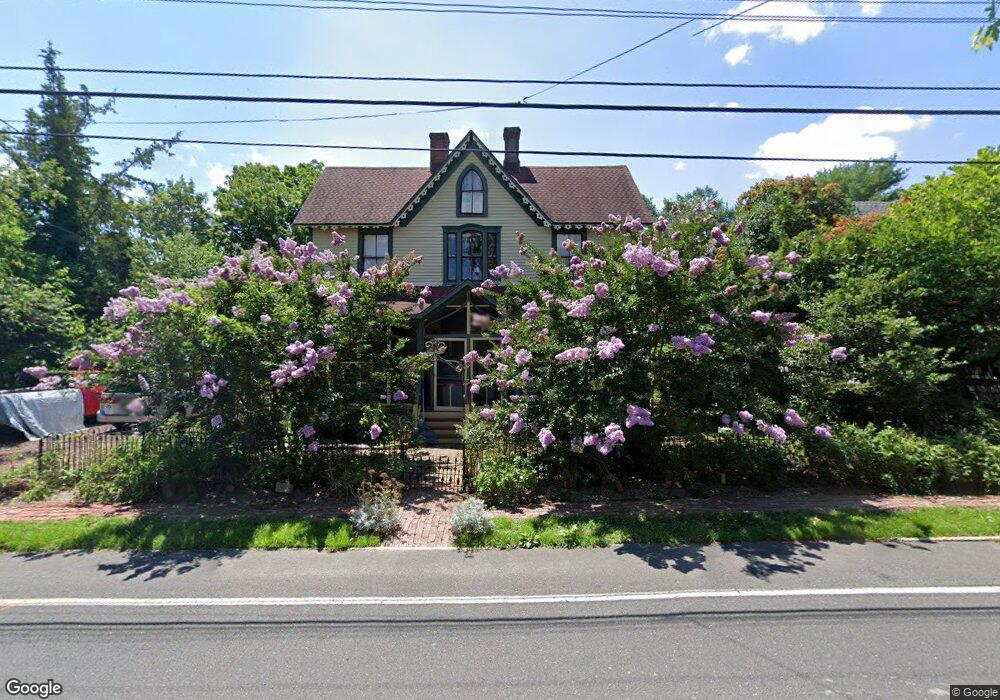
657 E Bay Ave Unit 8 Barnegat, NJ 08005
Barnegat Township NeighborhoodEstimated Value: $439,239 - $509,000
3
Beds
1
Bath
2,921
Sq Ft
$167/Sq Ft
Est. Value
About This Home
This home is located at 657 E Bay Ave Unit 8, Barnegat, NJ 08005 and is currently estimated at $489,060, approximately $167 per square foot. 657 E Bay Ave Unit 8 is a home located in Ocean County with nearby schools including Barnegat High School.
Ownership History
Date
Name
Owned For
Owner Type
Purchase Details
Closed on
Apr 15, 2016
Sold by
Fry John C and Fry Angela
Bought by
Haritnett Yolanda and Hartnett George Charles
Current Estimated Value
Purchase Details
Closed on
Mar 23, 2006
Sold by
Fry John C
Bought by
Fry John C and Fry Angela
Home Financials for this Owner
Home Financials are based on the most recent Mortgage that was taken out on this home.
Original Mortgage
$175,000
Interest Rate
6.03%
Mortgage Type
Fannie Mae Freddie Mac
Purchase Details
Closed on
Oct 10, 1995
Sold by
Reeve Myra
Bought by
Fry John and Fry Melissa
Home Financials for this Owner
Home Financials are based on the most recent Mortgage that was taken out on this home.
Original Mortgage
$146,000
Interest Rate
7.6%
Create a Home Valuation Report for This Property
The Home Valuation Report is an in-depth analysis detailing your home's value as well as a comparison with similar homes in the area
Home Values in the Area
Average Home Value in this Area
Purchase History
| Date | Buyer | Sale Price | Title Company |
|---|---|---|---|
| Haritnett Yolanda | $229,900 | Old Republic Natl Title | |
| Fry John C | -- | Southern Counties Title Agen | |
| Fry John | $182,000 | -- |
Source: Public Records
Mortgage History
| Date | Status | Borrower | Loan Amount |
|---|---|---|---|
| Previous Owner | Fry John C | $175,000 | |
| Previous Owner | Fry John | $146,000 |
Source: Public Records
Tax History Compared to Growth
Tax History
| Year | Tax Paid | Tax Assessment Tax Assessment Total Assessment is a certain percentage of the fair market value that is determined by local assessors to be the total taxable value of land and additions on the property. | Land | Improvement |
|---|---|---|---|---|
| 2025 | $7,055 | $237,000 | $105,400 | $131,600 |
| 2024 | $6,899 | $237,000 | $105,400 | $131,600 |
| 2023 | $6,676 | $237,000 | $105,400 | $131,600 |
| 2022 | $6,676 | $237,000 | $105,400 | $131,600 |
| 2021 | $6,645 | $237,000 | $105,400 | $131,600 |
| 2020 | $6,615 | $237,000 | $105,400 | $131,600 |
| 2019 | $6,518 | $237,000 | $105,400 | $131,600 |
| 2018 | $6,468 | $237,000 | $105,400 | $131,600 |
| 2017 | $6,361 | $237,000 | $105,400 | $131,600 |
| 2016 | $6,231 | $237,000 | $105,400 | $131,600 |
| 2015 | $6,034 | $237,000 | $105,400 | $131,600 |
| 2014 | $5,880 | $237,000 | $105,400 | $131,600 |
Source: Public Records
Map
Nearby Homes