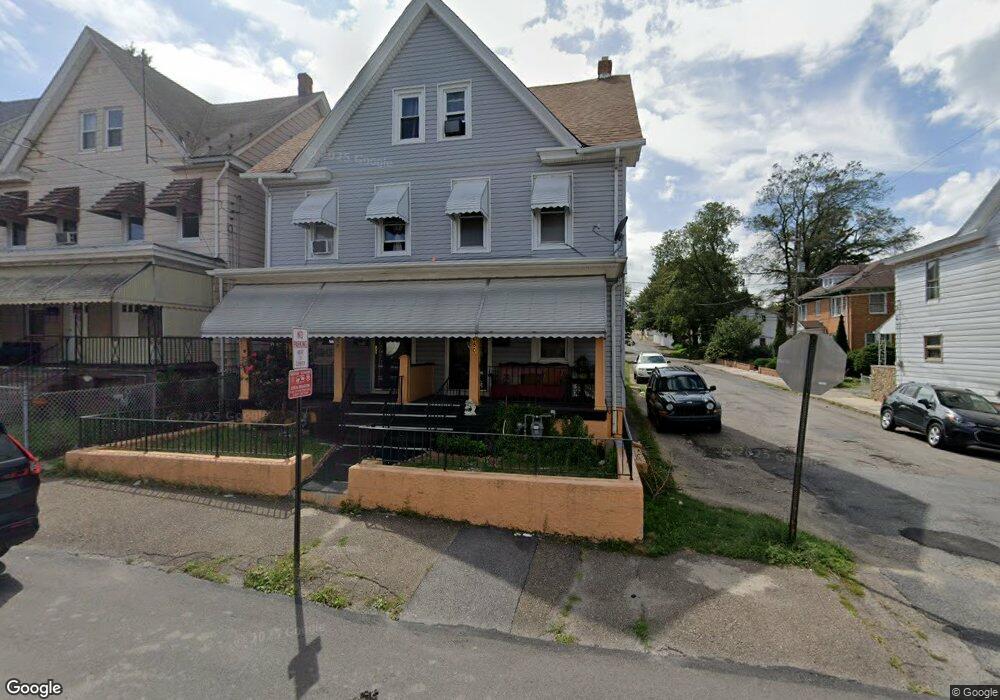
658 N James St Hazleton, PA 18201
Estimated Value: $172,301 - $396,000
--
Bed
--
Bath
3,375
Sq Ft
$88/Sq Ft
Est. Value
About This Home
This home is located at 658 N James St, Hazleton, PA 18201 and is currently estimated at $295,575, approximately $87 per square foot. 658 N James St is a home located in Luzerne County with nearby schools including Hazleton Area High School, Immanuel Christian School, and Holy Family Academy.
Ownership History
Date
Name
Owned For
Owner Type
Purchase Details
Closed on
Aug 21, 2015
Sold by
Montes Roque
Bought by
Beato Jose R and Beato Elsa M
Current Estimated Value
Home Financials for this Owner
Home Financials are based on the most recent Mortgage that was taken out on this home.
Original Mortgage
$96,224
Outstanding Balance
$76,618
Interest Rate
4.4%
Mortgage Type
FHA
Estimated Equity
$218,957
Purchase Details
Closed on
Oct 29, 2001
Bought by
Montes Roque
Create a Home Valuation Report for This Property
The Home Valuation Report is an in-depth analysis detailing your home's value as well as a comparison with similar homes in the area
Home Values in the Area
Average Home Value in this Area
Purchase History
| Date | Buyer | Sale Price | Title Company |
|---|---|---|---|
| Beato Jose R | $98,000 | None Available | |
| Montes Roque | $82,000 | -- |
Source: Public Records
Mortgage History
| Date | Status | Borrower | Loan Amount |
|---|---|---|---|
| Open | Beato Jose R | $96,224 |
Source: Public Records
Tax History Compared to Growth
Tax History
| Year | Tax Paid | Tax Assessment Tax Assessment Total Assessment is a certain percentage of the fair market value that is determined by local assessors to be the total taxable value of land and additions on the property. | Land | Improvement |
|---|---|---|---|---|
| 2025 | $2,815 | $98,000 | $23,800 | $74,200 |
| 2024 | $2,637 | $98,000 | $23,800 | $74,200 |
| 2023 | $2,466 | $98,000 | $23,800 | $74,200 |
| 2022 | $2,448 | $98,000 | $23,800 | $74,200 |
| 2021 | $2,391 | $98,000 | $23,800 | $74,200 |
| 2020 | $2,136 | $98,000 | $23,800 | $74,200 |
| 2019 | $2,204 | $98,000 | $23,800 | $74,200 |
| 2018 | $2,129 | $98,000 | $23,800 | $74,200 |
| 2017 | $1,963 | $98,000 | $23,800 | $74,200 |
| 2016 | $1,010 | $98,000 | $23,800 | $74,200 |
| 2015 | -- | $153,700 | $23,800 | $129,900 |
| 2014 | -- | $153,700 | $23,800 | $129,900 |
Source: Public Records
Map
Nearby Homes
- 756 Peace St
- 714 Alter St
- 782 N James St
- 522 N James St
- 1087 N Rear Locust St
- 572 N Vine St
- 590 Mckinley St
- 667 Roosevelt St
- 882 N Locust St
- 739 N Church St
- 827 N Vine St
- 1 W Diamond Ave
- 530 N Lee Ct
- 127 W Diamond Ave
- 60 E Jefferson Ave
- 163 N Church St
- 118 E Green St
- 738 N Manhattan Ct
- 14 W 5th St
- 523 N Laurel St