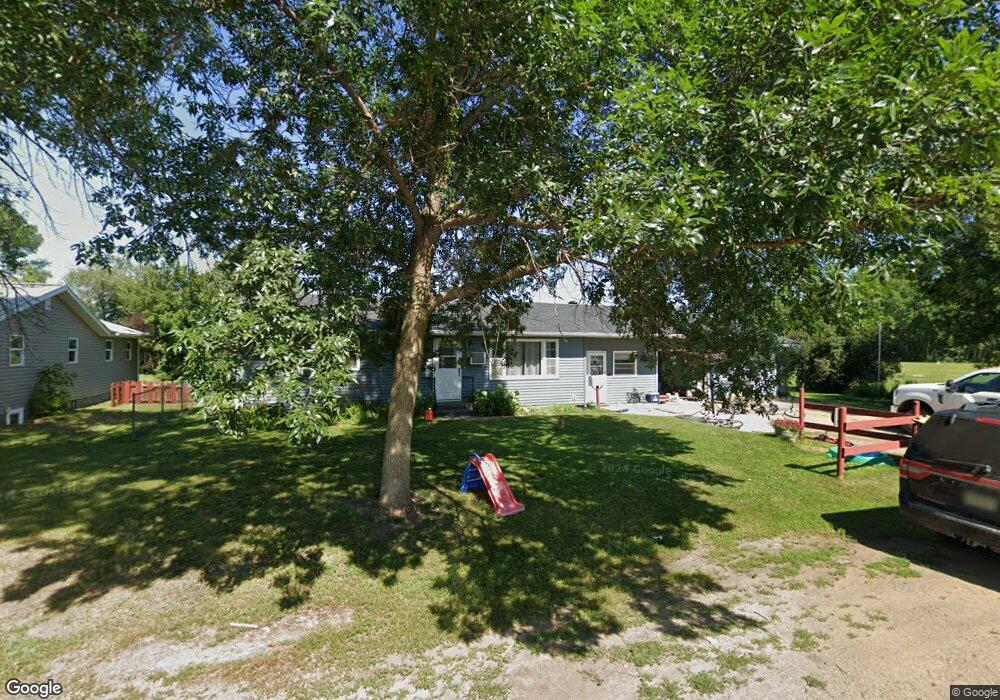
659 2nd Ave NW Perham, MN 56573
Estimated Value: $235,000 - $259,000
Studio
--
Bath
936
Sq Ft
$261/Sq Ft
Est. Value
About This Home
This home is located at 659 2nd Ave NW, Perham, MN 56573 and is currently estimated at $243,894, approximately $260 per square foot. 659 2nd Ave NW is a home located in Otter Tail County with nearby schools including Heart of the Lake Elementary School, Perham Senior High School, and St. Paul's Lutheran School.
Ownership History
Date
Name
Owned For
Owner Type
Purchase Details
Closed on
Jun 28, 2019
Bought by
Sandford Roger Roger
Current Estimated Value
Home Financials for this Owner
Home Financials are based on the most recent Mortgage that was taken out on this home.
Original Mortgage
$149,900
Outstanding Balance
$131,081
Interest Rate
3.73%
Estimated Equity
$112,813
Purchase Details
Closed on
Jun 14, 2018
Sold by
Sylvia Ramsay
Bought by
Pin Cherry Properties Llc
Create a Home Valuation Report for This Property
The Home Valuation Report is an in-depth analysis detailing your home's value as well as a comparison with similar homes in the area
Home Values in the Area
Average Home Value in this Area
Purchase History
| Date | Buyer | Sale Price | Title Company |
|---|---|---|---|
| Sandford Roger Roger | $149,900 | -- | |
| Pin Cherry Properties Llc | $70,000 | All American Title |
Source: Public Records
Mortgage History
| Date | Status | Borrower | Loan Amount |
|---|---|---|---|
| Open | Sandford Roger Roger | $149,900 |
Source: Public Records
Tax History
| Year | Tax Paid | Tax Assessment Tax Assessment Total Assessment is a certain percentage of the fair market value that is determined by local assessors to be the total taxable value of land and additions on the property. | Land | Improvement |
|---|---|---|---|---|
| 2025 | $2,162 | $225,700 | $10,900 | $214,800 |
| 2024 | $2,134 | $230,400 | $10,900 | $219,500 |
| 2023 | $2,088 | $200,500 | $9,900 | $190,600 |
| 2022 | $1,754 | $208,800 | $0 | $0 |
| 2021 | $1,558 | $200,500 | $9,900 | $190,600 |
| 2020 | $1,512 | $141,300 | $9,900 | $131,400 |
| 2019 | $1,434 | $131,700 | $9,900 | $121,800 |
| 2018 | $1,250 | $131,700 | $9,900 | $121,800 |
| 2017 | $1,234 | $116,100 | $9,900 | $106,200 |
| 2016 | $1,200 | $108,600 | $9,900 | $98,700 |
| 2015 | $1,050 | $0 | $0 | $0 |
| 2014 | -- | $101,500 | $9,900 | $91,600 |
Source: Public Records
Map
Nearby Homes
- 332 4th St NW
- 452 4th St NW
- 815 6th Ave NE
- 1012 6th Ave NE
- 1019 7th Ave NE
- 420 7th St NE
- 318 W Main St
- 155 4th Ave SW
- 357 5th Ave SW
- 921 9th St NW
- 710 11th St NW
- 1003 8th Ave NW
- 1218 8th Ave NW
- 805 9th Ave SW Unit B
- 829 9th Ave SW
- 902 9th St SW
- 45329 Red Pine Loop
- 46136 Little Pine Loop
- 44198 Mosquito Trail
- 45907 County Highway 8
Your Personal Tour Guide
Ask me questions while you tour the home.