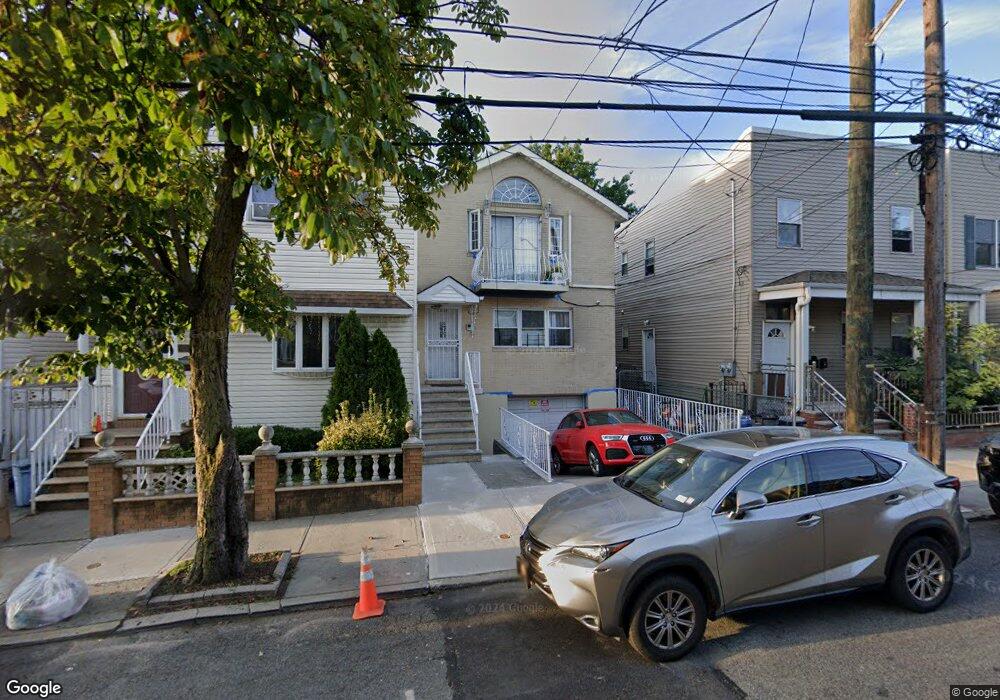
66-28 53rd Ave Unit 1 for Flushing, NY 11378
Maspeth NeighborhoodEstimated Value: $1,184,000 - $1,406,084
3
Beds
2
Baths
2,800
Sq Ft
$468/Sq Ft
Est. Value
About This Home
This home is located at 66-28 53rd Ave Unit 1 for, Flushing, NY 11378 and is currently estimated at $1,309,771, approximately $467 per square foot. 66-28 53rd Ave Unit 1 for is a home located in Queens County with nearby schools including P.S. 229 Emanuel Kaplan, IS 73 - The Frank Sansivieri School, and Grover Cleveland High School.
Ownership History
Date
Name
Owned For
Owner Type
Purchase Details
Closed on
Oct 4, 2005
Sold by
Chen Yi Qin and Lu Ming Yu
Bought by
Chan Sang Man and Ren Li
Current Estimated Value
Home Financials for this Owner
Home Financials are based on the most recent Mortgage that was taken out on this home.
Original Mortgage
$40,650
Outstanding Balance
$21,436
Interest Rate
5.72%
Estimated Equity
$1,288,335
Purchase Details
Closed on
May 3, 2002
Sold by
Mcgonnell James and Mc Gonnell Vera
Bought by
Lu Ming Yu and Chen Yi Qin
Home Financials for this Owner
Home Financials are based on the most recent Mortgage that was taken out on this home.
Original Mortgage
$367,500
Interest Rate
6.81%
Purchase Details
Closed on
Jun 23, 2000
Sold by
Twomey Mary
Bought by
James & Vera Mcgonnell Llc
Purchase Details
Closed on
Jun 28, 1999
Sold by
Dolan Bridie
Bought by
Twomey Mary
Create a Home Valuation Report for This Property
The Home Valuation Report is an in-depth analysis detailing your home's value as well as a comparison with similar homes in the area
Home Values in the Area
Average Home Value in this Area
Purchase History
| Date | Buyer | Sale Price | Title Company |
|---|---|---|---|
| Chan Sang Man | $813,000 | -- | |
| Chan Sang Man | $813,000 | -- | |
| Lu Ming Yu | -- | -- | |
| Lu Ming Yu | -- | -- | |
| James & Vera Mcgonnell Llc | $270,000 | -- | |
| James & Vera Mcgonnell Llc | $270,000 | -- | |
| Twomey Mary | -- | -- | |
| Twomey Mary | -- | -- |
Source: Public Records
Mortgage History
| Date | Status | Borrower | Loan Amount |
|---|---|---|---|
| Open | Chan Sang Man | $40,650 | |
| Closed | Chan Sang Man | $40,650 | |
| Open | Chan Sang Man | $569,100 | |
| Closed | Chan Sang Man | $569,100 | |
| Previous Owner | Lu Ming Yu | $367,500 |
Source: Public Records
Tax History
| Year | Tax Paid | Tax Assessment Tax Assessment Total Assessment is a certain percentage of the fair market value that is determined by local assessors to be the total taxable value of land and additions on the property. | Land | Improvement |
|---|---|---|---|---|
| 2025 | $11,963 | $64,621 | $7,548 | $57,073 |
| 2024 | $11,975 | $60,964 | $8,533 | $52,431 |
| 2023 | $11,271 | $57,514 | $6,962 | $50,552 |
| 2022 | $10,545 | $74,340 | $10,800 | $63,540 |
| 2021 | $11,123 | $72,540 | $10,800 | $61,740 |
| 2020 | $11,103 | $65,640 | $10,800 | $54,840 |
| 2019 | $10,335 | $56,220 | $10,800 | $45,420 |
| 2018 | $9,472 | $47,928 | $8,491 | $39,437 |
| 2017 | $8,918 | $45,216 | $8,451 | $36,765 |
| 2016 | $8,729 | $45,216 | $8,451 | $36,765 |
| 2015 | $4,925 | $44,876 | $9,330 | $35,546 |
| 2014 | $4,925 | $42,336 | $10,558 | $31,778 |
Source: Public Records
Map
Nearby Homes
- 6616 52nd Dr
- 52-62 68th St
- 52-61 66th St
- 53-36 67th St
- 53-24 66th St
- 53-36 66th St
- 5307 65th Place
- 52-60 65th Place Unit 5E
- 67-36 52nd Rd
- 52-21 65th Place Unit 6P
- 5221 65th Place Unit 6N
- 6731 52nd Rd
- 67-20 52nd Ave Unit 2G
- 52-24 65th Place Unit 3K
- 52-15 65th Place Unit 3A
- 52-14 69th St
- 52-16 69th Place
- 5351 63rd St
- 71-10 52nd Ave
- 68-02 Jay Ave
- 66-28 53rd Ave
- 6628 53rd Ave
- 6630 53rd Ave
- 6630 53rd Ave
- 6624 53rd Ave
- 6624 53rd Ave
- 6624 53rd Ave Unit 2
- 6624 53rd Ave Unit 2 Fl.
- 6624 53rd Ave Unit 2 Fl.
- 6632 53rd Ave
- 6632 53rd Ave
- 6632 53rd Ave
- 6622 53rd Ave
- 6636 53rd Ave
- 6620 53rd Ave
- 66-29 53rd Rd Unit 1st Fl
- 66-29 53rd Rd
- 6629 53rd Rd
- 6625 53rd Rd
- 66-29 53rd Dr Unit 1st Fl
Your Personal Tour Guide
Ask me questions while you tour the home.