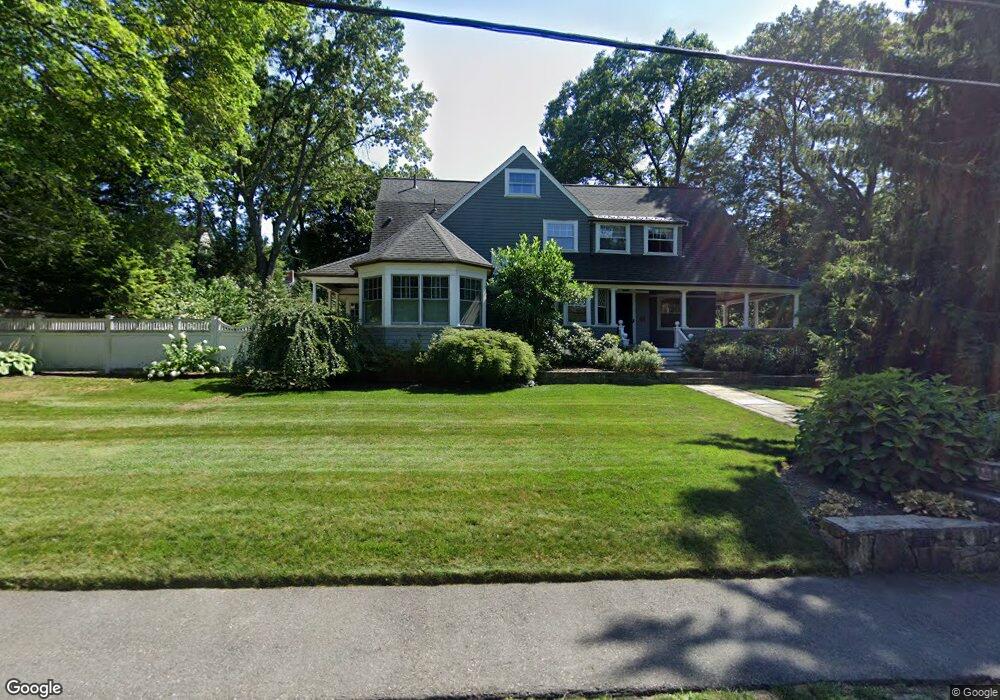
66 Berkeley St West Newton, MA 02465
West Newton NeighborhoodEstimated Value: $2,777,921 - $3,540,000
5
Beds
4
Baths
4,023
Sq Ft
$762/Sq Ft
Est. Value
About This Home
This home is located at 66 Berkeley St, West Newton, MA 02465 and is currently estimated at $3,066,730, approximately $762 per square foot. 66 Berkeley St is a home located in Middlesex County with nearby schools including Peirce Elementary School, F.A. Day Middle School, and Newton North High School.
Ownership History
Date
Name
Owned For
Owner Type
Purchase Details
Closed on
Sep 18, 2025
Sold by
Riley Thomas N
Bought by
Thomas N Riley Ret 2022 and Riley
Current Estimated Value
Purchase Details
Closed on
Jan 11, 2021
Sold by
Dianne C Riley 1993 T C and Dianne Riley
Bought by
Riley Thomas N
Purchase Details
Closed on
Apr 23, 2014
Sold by
Riley Thomas and Riley Dianne C
Bought by
Dianne C Riley T C and Dianne Riley
Purchase Details
Closed on
Apr 30, 1991
Sold by
Leland Frances A
Bought by
Riley Thomas N and Riley Dianne C
Create a Home Valuation Report for This Property
The Home Valuation Report is an in-depth analysis detailing your home's value as well as a comparison with similar homes in the area
Home Values in the Area
Average Home Value in this Area
Purchase History
| Date | Buyer | Sale Price | Title Company |
|---|---|---|---|
| Thomas N Riley Ret 2022 | -- | -- | |
| Riley Thomas N | -- | None Available | |
| Dianne C Riley T C | -- | -- | |
| Dianne C Riley T | -- | -- | |
| Riley Thomas N | $405,000 | -- |
Source: Public Records
Mortgage History
| Date | Status | Borrower | Loan Amount |
|---|---|---|---|
| Previous Owner | Riley Thomas N | $385,000 | |
| Previous Owner | Riley Thomas N | $500,000 | |
| Previous Owner | Riley Thomas N | $400,000 |
Source: Public Records
Tax History Compared to Growth
Tax History
| Year | Tax Paid | Tax Assessment Tax Assessment Total Assessment is a certain percentage of the fair market value that is determined by local assessors to be the total taxable value of land and additions on the property. | Land | Improvement |
|---|---|---|---|---|
| 2025 | $26,194 | $2,672,900 | $1,407,000 | $1,265,900 |
| 2024 | $25,327 | $2,595,000 | $1,366,000 | $1,229,000 |
| 2023 | $24,207 | $2,377,900 | $1,077,300 | $1,300,600 |
| 2022 | $23,163 | $2,201,800 | $997,500 | $1,204,300 |
| 2021 | $22,351 | $2,077,200 | $941,000 | $1,136,200 |
| 2020 | $21,686 | $2,077,200 | $941,000 | $1,136,200 |
| 2019 | $21,075 | $2,016,700 | $913,600 | $1,103,100 |
| 2018 | $20,529 | $1,897,300 | $818,900 | $1,078,400 |
| 2017 | $19,904 | $1,789,900 | $772,500 | $1,017,400 |
| 2016 | $19,036 | $1,672,800 | $722,000 | $950,800 |
| 2015 | $18,151 | $1,563,400 | $674,800 | $888,600 |
Source: Public Records
Map
Nearby Homes
- 10 Ruane Rd
- 18 Sewall St
- 279 Chestnut St
- 222 Prince St
- 39 Valentine Park
- 68 Mignon Rd
- 12 Inis Cir
- 1488 Washington St Unit 1488
- 308 Prince St
- 443 Chestnut St
- 79 Chestnut St Unit 2
- 0 Duncan Rd Unit 72925240
- 1639 Washington St
- 4 Hosmer Cir
- 17 Gilbert St
- 479 Chestnut St
- 36 Troy Ln
- 70 Bigelow Rd
- 51 Bourne St
- 1230 Commonwealth Ave