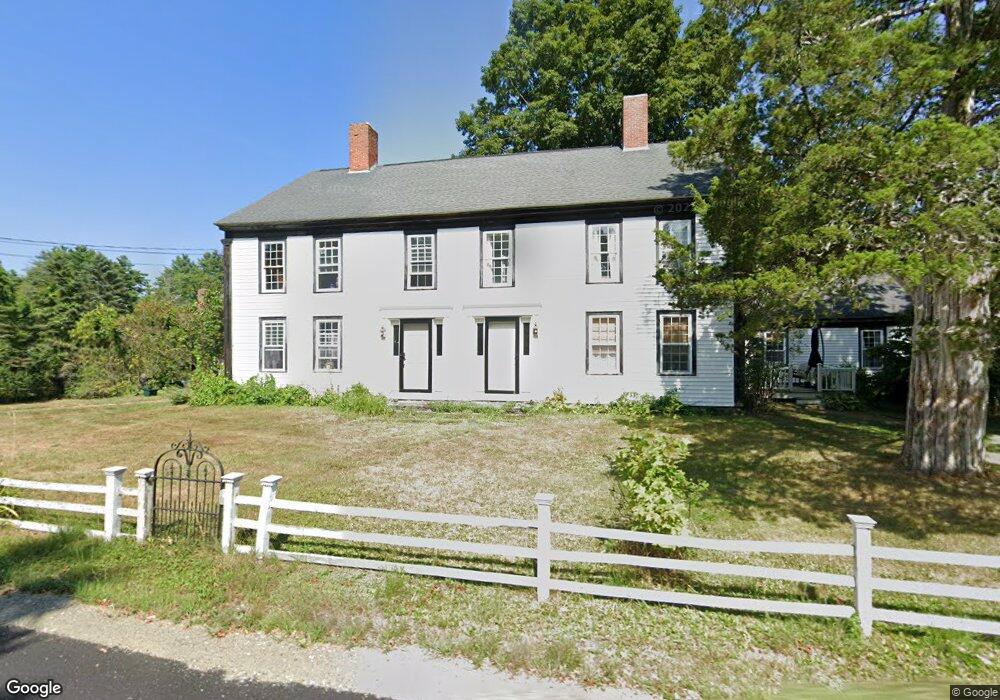
66 Elm St New Salem, MA 01355
New Salem NeighborhoodEstimated Value: $369,920 - $515,000
5
Beds
2
Baths
4,252
Sq Ft
$100/Sq Ft
Est. Value
About This Home
This home is located at 66 Elm St, New Salem, MA 01355 and is currently estimated at $423,730, approximately $99 per square foot. 66 Elm St is a home located in Franklin County with nearby schools including Swift River School and Ralph C Mahar Regional School.
Ownership History
Date
Name
Owned For
Owner Type
Purchase Details
Closed on
Dec 17, 2007
Sold by
Spaulding George F and Spaulding Donna L
Bought by
Wolfe Karl and Wolfe Michelle
Current Estimated Value
Home Financials for this Owner
Home Financials are based on the most recent Mortgage that was taken out on this home.
Original Mortgage
$215,200
Outstanding Balance
$133,726
Interest Rate
6.3%
Mortgage Type
Purchase Money Mortgage
Estimated Equity
$290,004
Create a Home Valuation Report for This Property
The Home Valuation Report is an in-depth analysis detailing your home's value as well as a comparison with similar homes in the area
Home Values in the Area
Average Home Value in this Area
Purchase History
| Date | Buyer | Sale Price | Title Company |
|---|---|---|---|
| Wolfe Karl | $269,000 | -- |
Source: Public Records
Mortgage History
| Date | Status | Borrower | Loan Amount |
|---|---|---|---|
| Open | Wolfe Karl | $215,200 |
Source: Public Records
Tax History
| Year | Tax Paid | Tax Assessment Tax Assessment Total Assessment is a certain percentage of the fair market value that is determined by local assessors to be the total taxable value of land and additions on the property. | Land | Improvement |
|---|---|---|---|---|
| 2025 | $4,389 | $323,200 | $53,600 | $269,600 |
| 2024 | $4,420 | $307,600 | $53,600 | $254,000 |
| 2023 | $4,671 | $304,300 | $54,700 | $249,600 |
| 2022 | $4,213 | $222,700 | $54,700 | $168,000 |
| 2021 | $3,995 | $203,500 | $50,200 | $153,300 |
| 2020 | $3,671 | $203,500 | $50,200 | $153,300 |
| 2019 | $3,575 | $203,500 | $50,200 | $153,300 |
| 2018 | $3,717 | $205,000 | $48,700 | $156,300 |
| 2017 | $3,512 | $195,900 | $46,500 | $149,400 |
| 2016 | $3,375 | $195,900 | $46,500 | $149,400 |
| 2015 | -- | $220,100 | $50,200 | $169,900 |
Source: Public Records
Map
Nearby Homes
- 2 Fay Rd
- 610 S Main St
- 0 Quabbin Blvd
- 520 S Main St
- 246 Holtshire Rd Unit Lot 3
- 490 S Main St
- 0 Jennison Rd Unit 73472812
- 395 S Main St
- Lt 55 Wendell Rd
- 75 Sandrah Dr
- 216 Holtshire Rd
- 270 S Main St
- 27 Chase St
- 53 Earl Dr
- 78 Earl Dr
- 222 W River St
- 168 Robert Dr
- 12-14 E Main St
- 58 E Main St
- 50 E Main St
Your Personal Tour Guide
Ask me questions while you tour the home.