
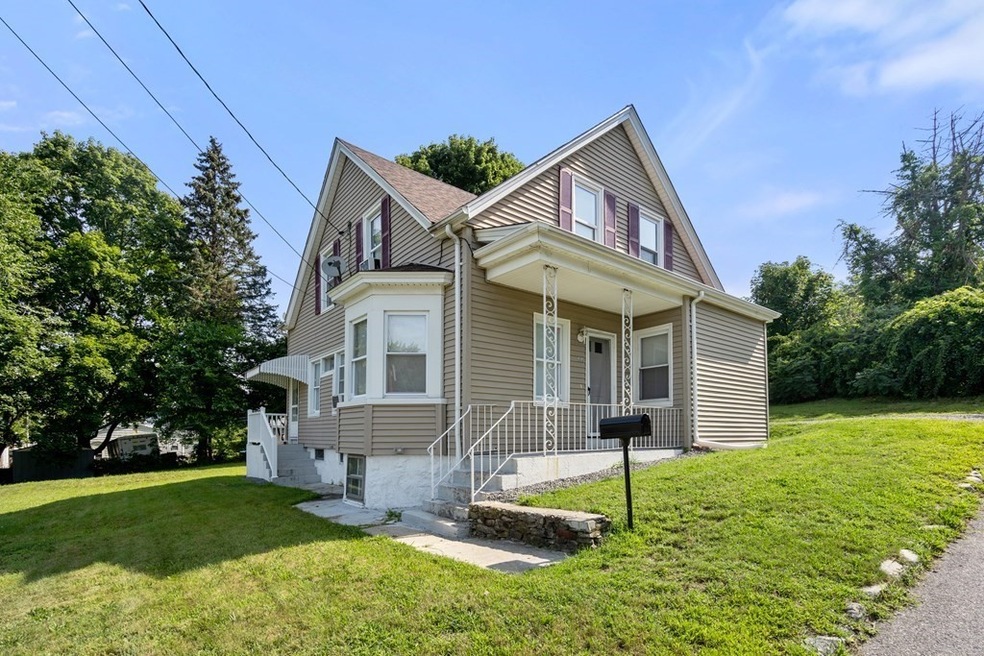
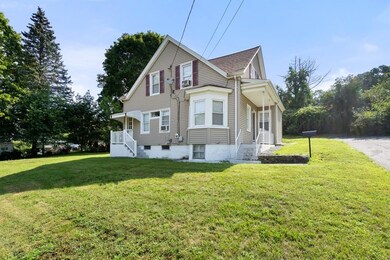
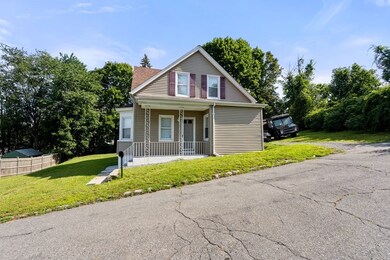
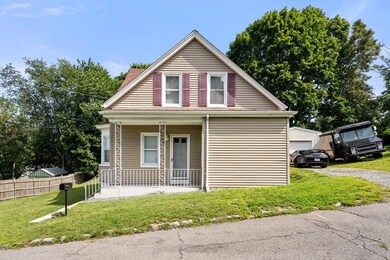
66 Haskell St Fall River, MA 02720
Western Fall River Neighborhood
3
Beds
2
Baths
1,479
Sq Ft
0.26
Acres
Highlights
- Stainless Steel Appliances
- Recessed Lighting
- Ceiling Fan
- Dual Closets
- Ceramic Tile Flooring
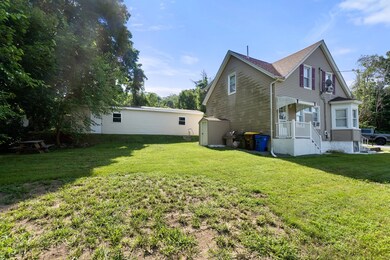
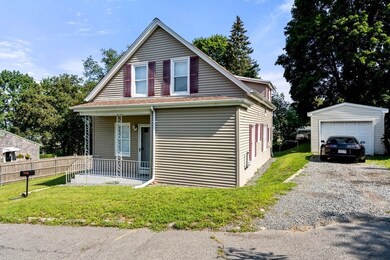
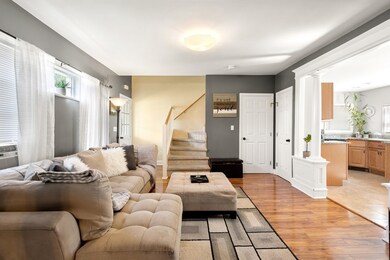
About This Home
As of October 2021You don't want to miss this charming, beautifully remodeled home with everything you need! Quiet side street on a large lot with plenty of outdoor space to run around or entertain, along with an extra large detached garage for that car enthusiast, man cave or storing all those extra things! This welcoming home has an open concept feel with living room, dining room, updated kitchen with stainless steel appliances and peninsula seating. Decorative pillars on the main floor ad to the unique charm of this home. In addition, the first floor has a bedroom with ensuite bath, currently being used as kids playroom. Upstairs you will find two more bedrooms and a full bath. You won't be disappointed with the size of the master bedroom with double closets and plenty of room to set up an office nook. Remodeled kitchen, baths and new roof in 2017. This home has natural gas, new tankless hot water system 2020. Easy highway access! Nothing to do but move in and enjoy everything this home has to offer!
Home Details
Home Type
- Single Family
Est. Annual Taxes
- $4,466
Year Built
- 1940
Parking
- 1
Interior Spaces
- Ceiling Fan
- Recessed Lighting
- Stainless Steel Appliances
Flooring
- Wall to Wall Carpet
- Laminate
- Ceramic Tile
Bedrooms and Bathrooms
- Primary bedroom located on second floor
- Dual Closets
Ownership History
Date
Name
Owned For
Owner Type
Purchase Details
Listed on
Jan 24, 2017
Closed on
Jun 2, 2017
Sold by
L & L Amarantes Irt
Bought by
Amarantes Lorraine J
Seller's Agent
Manny Lindo
Highland Real Estate Group
Buyer's Agent
Jen Conley
Coldwell Banker Realty - Westwood
List Price
$259,000
Sold Price
$249,900
Premium/Discount to List
-$9,100
-3.51%
Total Days on Market
5
Current Estimated Value
Home Financials for this Owner
Home Financials are based on the most recent Mortgage that was taken out on this home.
Estimated Appreciation
$223,664
Avg. Annual Appreciation
8.59%
Original Mortgage
$241,530
Interest Rate
3.94%
Mortgage Type
New Conventional
Purchase Details
Listed on
Apr 5, 2016
Closed on
May 31, 2016
Sold by
Nationstar Mortgage Ll
Bought by
Wilmington Svgs Fund S
Seller's Agent
Matthew Escaler
Vylla Home
Buyer's Agent
Matthew Escaler
Vylla Home
List Price
$95,900
Sold Price
$75,000
Premium/Discount to List
-$20,900
-21.79%
Home Financials for this Owner
Home Financials are based on the most recent Mortgage that was taken out on this home.
Avg. Annual Appreciation
190.12%
Original Mortgage
$74,000
Interest Rate
3.57%
Mortgage Type
Unknown
Purchase Details
Closed on
Aug 24, 2015
Sold by
Amarantes Lorraine J
Bought by
Nationstar Mortgage Llc
Purchase Details
Closed on
Dec 30, 2009
Sold by
L & L Amarantes Irt
Bought by
Amarantes Lorraine J
Home Financials for this Owner
Home Financials are based on the most recent Mortgage that was taken out on this home.
Original Mortgage
$307,500
Interest Rate
4.85%
Mortgage Type
Reverse Mortgage Home Equity Conversion Mortgage
Map
Create a Home Valuation Report for This Property
The Home Valuation Report is an in-depth analysis detailing your home's value as well as a comparison with similar homes in the area
Similar Homes in Fall River, MA
Home Values in the Area
Average Home Value in this Area
Purchase History
| Date | Type | Sale Price | Title Company |
|---|---|---|---|
| Deed | -- | -- | |
| Deed | -- | -- | |
| Foreclosure Deed | $162,000 | -- | |
| Deed | -- | -- |
Source: Public Records
Mortgage History
| Date | Status | Loan Amount | Loan Type |
|---|---|---|---|
| Open | $366,244 | FHA | |
| Closed | $241,530 | New Conventional | |
| Previous Owner | $74,000 | Unknown | |
| Previous Owner | $307,500 | Reverse Mortgage Home Equity Conversion Mortgage | |
| Previous Owner | $40,000 | No Value Available | |
| Previous Owner | $40,000 | No Value Available |
Source: Public Records
Property History
| Date | Event | Price | Change | Sq Ft Price |
|---|---|---|---|---|
| 10/15/2021 10/15/21 | Sold | $373,000 | +9.7% | $252 / Sq Ft |
| 08/30/2021 08/30/21 | Pending | -- | -- | -- |
| 08/24/2021 08/24/21 | For Sale | $339,900 | +36.0% | $230 / Sq Ft |
| 07/18/2017 07/18/17 | Sold | $249,900 | +0.4% | $204 / Sq Ft |
| 07/13/2017 07/13/17 | Price Changed | $249,000 | -3.9% | $203 / Sq Ft |
| 07/13/2017 07/13/17 | Pending | -- | -- | -- |
| 07/13/2017 07/13/17 | Price Changed | $259,000 | 0.0% | $211 / Sq Ft |
| 07/13/2017 07/13/17 | For Sale | $259,000 | +4.0% | $211 / Sq Ft |
| 02/22/2017 02/22/17 | Pending | -- | -- | -- |
| 02/11/2017 02/11/17 | Price Changed | $249,000 | -0.4% | $203 / Sq Ft |
| 02/02/2017 02/02/17 | Price Changed | $249,900 | +0.4% | $204 / Sq Ft |
| 01/28/2017 01/28/17 | Price Changed | $249,000 | -0.4% | $203 / Sq Ft |
| 01/24/2017 01/24/17 | For Sale | $249,900 | +233.2% | $204 / Sq Ft |
| 05/31/2016 05/31/16 | Sold | $75,000 | -21.8% | $61 / Sq Ft |
| 05/01/2016 05/01/16 | Pending | -- | -- | -- |
| 04/05/2016 04/05/16 | For Sale | $95,900 | -- | $78 / Sq Ft |
Source: MLS Property Information Network (MLS PIN)
Tax History
| Year | Tax Paid | Tax Assessment Tax Assessment Total Assessment is a certain percentage of the fair market value that is determined by local assessors to be the total taxable value of land and additions on the property. | Land | Improvement |
|---|---|---|---|---|
| 2025 | $4,466 | $390,000 | $121,600 | $268,400 |
| 2024 | $4,255 | $370,300 | $119,200 | $251,100 |
| 2023 | $4,184 | $341,000 | $107,400 | $233,600 |
| 2022 | $3,770 | $298,700 | $101,300 | $197,400 |
| 2021 | $3,505 | $253,400 | $96,800 | $156,600 |
| 2020 | $3,295 | $228,000 | $92,400 | $135,600 |
| 2019 | $3,320 | $227,700 | $96,600 | $131,100 |
| 2018 | $3,085 | $211,000 | $97,300 | $113,700 |
| 2017 | $2,843 | $203,100 | $97,300 | $105,800 |
| 2016 | $2,737 | $200,800 | $100,200 | $100,600 |
| 2015 | $2,626 | $200,800 | $100,200 | $100,600 |
| 2014 | $2,526 | $200,800 | $100,200 | $100,600 |
Source: Public Records
Source: MLS Property Information Network (MLS PIN)
MLS Number: 72885464
APN: FALL-000021T-000000-000003
Disclaimer: Certain information contained herein is derived from information provided by parties other than Homes.com. All information provided is deemed reliable, but is not guaranteed to be accurate and should be independently verified.
![]() The property listing data and information, or the Images, set forth herein were provided to MLS Property Information Network, Inc. from third party sources, including sellers, lessors and public records, and were compiled by MLS Property Information Network, Inc. The property listing data and information, and the Images, are for the personal, non-commercial use of consumers having a good faith interest in purchasing or leasing listed properties of the type displayed to them and may not be used for any purpose other than to identify prospective properties which such consumers may have a good faith interest in purchasing or leasing. MLS Property Information Network, Inc. and its subscribers disclaim any and all representations and warranties as to the accuracy of the property listing data and information, or as to the accuracy of any of the Images, set forth herein.
The property listing data and information, or the Images, set forth herein were provided to MLS Property Information Network, Inc. from third party sources, including sellers, lessors and public records, and were compiled by MLS Property Information Network, Inc. The property listing data and information, and the Images, are for the personal, non-commercial use of consumers having a good faith interest in purchasing or leasing listed properties of the type displayed to them and may not be used for any purpose other than to identify prospective properties which such consumers may have a good faith interest in purchasing or leasing. MLS Property Information Network, Inc. and its subscribers disclaim any and all representations and warranties as to the accuracy of the property listing data and information, or as to the accuracy of any of the Images, set forth herein.
Nearby Homes
- 492 Quincy St Unit 3
- 327 Quincy St
- 3063 N Main St
- 409 Crescent St
- 74 Terri Marie Way Unit 6
- 50 Clark St Unit 12
- 203 Martha St
- Lot 40-A Jones St
- Lot 40-B Jones St
- 1928 N Main St Unit 4
- 1720 Robeson St
- 230 College Park Rd
- 3795 N Main St Unit C
- 201 Montgomery Cir
- 987 Wilson Rd
- 393 Langley St
- 3850 N Main St Unit 3850
- 208 Florence St
- 361 Adams Unit Lot 41
- 1493 Meridian St