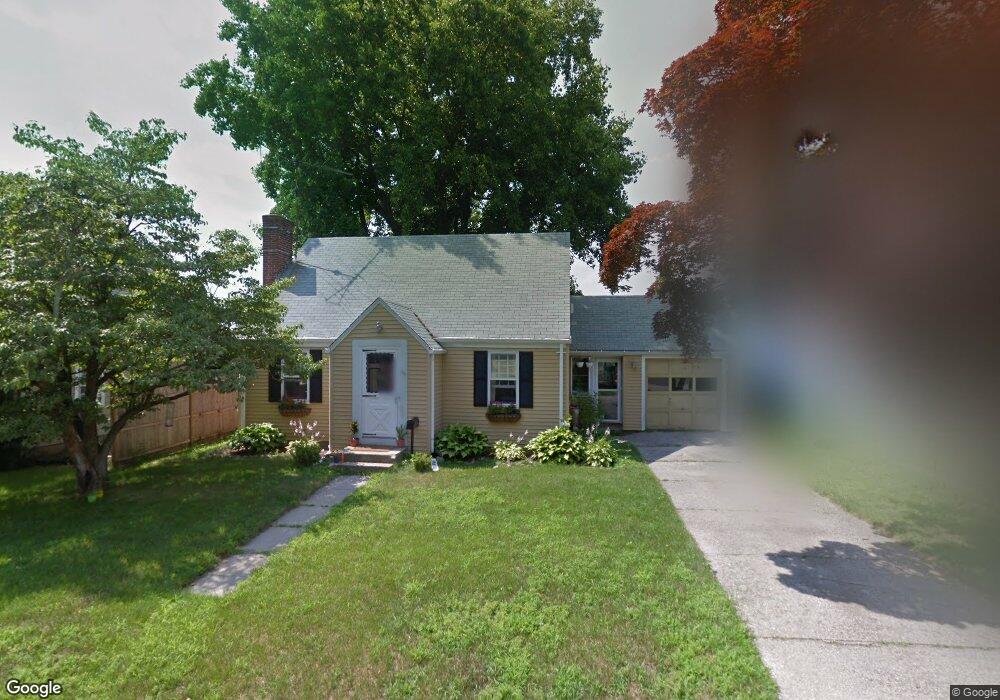
66 Howland Rd Cranston, RI 02910
Eden Park NeighborhoodEstimated Value: $389,125 - $440,000
3
Beds
1
Bath
1,157
Sq Ft
$349/Sq Ft
Est. Value
About This Home
This home is located at 66 Howland Rd, Cranston, RI 02910 and is currently estimated at $404,031, approximately $349 per square foot. 66 Howland Rd is a home located in Providence County with nearby schools including Park View Middle School, Cranston High School East, and Nel/Cps Construction Career.
Ownership History
Date
Name
Owned For
Owner Type
Purchase Details
Closed on
Jan 19, 2021
Sold by
Bellisle Peter T and Bellisle Christina M
Bought by
Bellisle Peter T
Current Estimated Value
Home Financials for this Owner
Home Financials are based on the most recent Mortgage that was taken out on this home.
Original Mortgage
$180,000
Outstanding Balance
$158,841
Interest Rate
2.6%
Mortgage Type
New Conventional
Estimated Equity
$245,190
Purchase Details
Closed on
Mar 30, 2010
Sold by
Bellisle Martha M
Bought by
Bellisle Peter and Bellisle Christina M
Home Financials for this Owner
Home Financials are based on the most recent Mortgage that was taken out on this home.
Original Mortgage
$156,695
Interest Rate
5.02%
Mortgage Type
Purchase Money Mortgage
Create a Home Valuation Report for This Property
The Home Valuation Report is an in-depth analysis detailing your home's value as well as a comparison with similar homes in the area
Home Values in the Area
Average Home Value in this Area
Purchase History
| Date | Buyer | Sale Price | Title Company |
|---|---|---|---|
| Bellisle Peter T | -- | None Available | |
| Bellisle Peter | $172,000 | -- |
Source: Public Records
Mortgage History
| Date | Status | Borrower | Loan Amount |
|---|---|---|---|
| Open | Bellisle Peter T | $180,000 | |
| Previous Owner | Bellisle Peter | $156,695 |
Source: Public Records
Tax History
| Year | Tax Paid | Tax Assessment Tax Assessment Total Assessment is a certain percentage of the fair market value that is determined by local assessors to be the total taxable value of land and additions on the property. | Land | Improvement |
|---|---|---|---|---|
| 2025 | $4,542 | $327,200 | $107,700 | $219,500 |
| 2024 | $4,393 | $322,800 | $107,700 | $215,100 |
| 2023 | $4,287 | $226,800 | $70,900 | $155,900 |
| 2022 | $4,198 | $226,800 | $70,900 | $155,900 |
| 2021 | $4,082 | $226,800 | $70,900 | $155,900 |
| 2020 | $3,726 | $179,400 | $67,500 | $111,900 |
| 2019 | $3,726 | $179,400 | $67,500 | $111,900 |
| 2018 | $3,640 | $179,400 | $67,500 | $111,900 |
| 2017 | $3,542 | $154,400 | $60,700 | $93,700 |
| 2016 | $3,466 | $154,400 | $60,700 | $93,700 |
| 2015 | $3,334 | $148,500 | $60,700 | $87,800 |
| 2014 | $3,403 | $149,000 | $60,700 | $88,300 |
Source: Public Records
Map
Nearby Homes
Your Personal Tour Guide
Ask me questions while you tour the home.