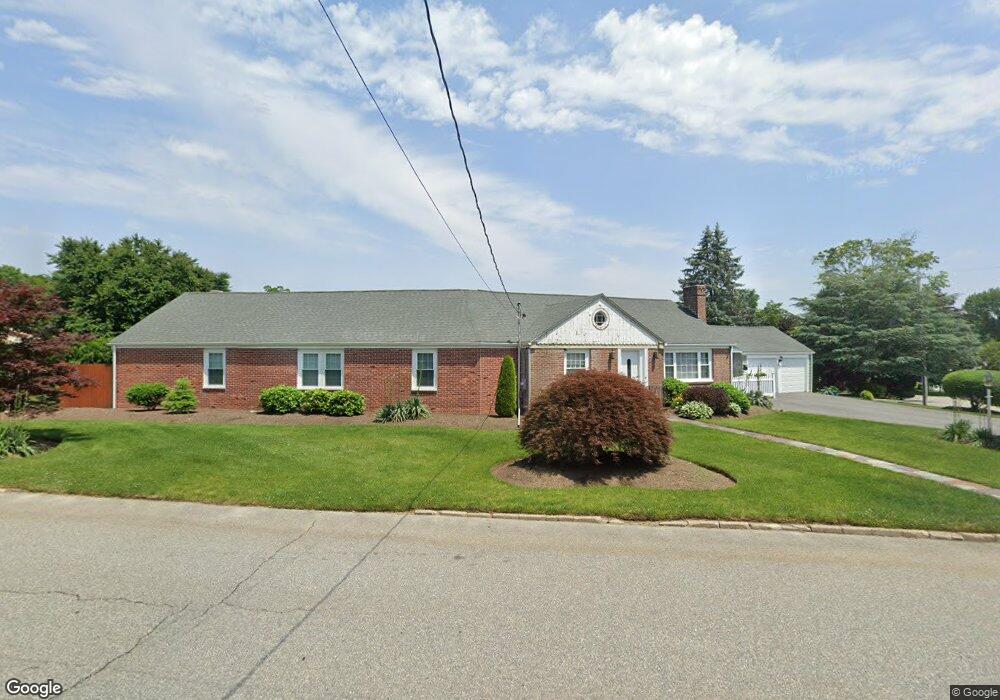
66 Lawnacre Dr Cranston, RI 02920
Garden City NeighborhoodEstimated Value: $559,000 - $751,000
2
Beds
2
Baths
2,556
Sq Ft
$261/Sq Ft
Est. Value
About This Home
This home is located at 66 Lawnacre Dr, Cranston, RI 02920 and is currently estimated at $666,872, approximately $260 per square foot. 66 Lawnacre Dr is a home located in Providence County with nearby schools including Garden City School, Western Hills Middle School, and Cranston High School West.
Ownership History
Date
Name
Owned For
Owner Type
Purchase Details
Closed on
Dec 14, 2021
Sold by
Pena Eddie
Bought by
Garcia Felix N and Garcia Miriam E
Current Estimated Value
Purchase Details
Closed on
May 31, 2017
Sold by
Ramirez Construction L
Bought by
Garcia Felix N and Nunez Miriam E
Home Financials for this Owner
Home Financials are based on the most recent Mortgage that was taken out on this home.
Original Mortgage
$265,109
Interest Rate
4.21%
Mortgage Type
FHA
Purchase Details
Closed on
Jan 19, 2011
Sold by
Taveras Rafael
Bought by
Tavers Rafael
Purchase Details
Closed on
Oct 20, 2008
Sold by
Gutierrez Elisa
Bought by
Taveras Rafael
Home Financials for this Owner
Home Financials are based on the most recent Mortgage that was taken out on this home.
Original Mortgage
$228,000
Interest Rate
6.41%
Mortgage Type
Purchase Money Mortgage
Purchase Details
Closed on
Dec 22, 2005
Sold by
Deleon Vilma A and Biernacki Stephen
Bought by
Santana Luis
Create a Home Valuation Report for This Property
The Home Valuation Report is an in-depth analysis detailing your home's value as well as a comparison with similar homes in the area
Home Values in the Area
Average Home Value in this Area
Purchase History
| Date | Buyer | Sale Price | Title Company |
|---|---|---|---|
| Garcia Felix N | -- | None Available | |
| Garcia Felix N | $270,000 | -- | |
| Tavers Rafael | -- | -- | |
| Taveras Rafael | $285,000 | -- | |
| Santana Luis | $415,000 | -- |
Source: Public Records
Mortgage History
| Date | Status | Borrower | Loan Amount |
|---|---|---|---|
| Previous Owner | Santana Luis | $265,109 | |
| Previous Owner | Santana Luis | $228,000 |
Source: Public Records
Tax History Compared to Growth
Tax History
| Year | Tax Paid | Tax Assessment Tax Assessment Total Assessment is a certain percentage of the fair market value that is determined by local assessors to be the total taxable value of land and additions on the property. | Land | Improvement |
|---|---|---|---|---|
| 2025 | $8,467 | $610,000 | $164,200 | $445,800 |
| 2024 | $8,302 | $610,000 | $164,200 | $445,800 |
| 2023 | $6,434 | $340,400 | $117,400 | $223,000 |
| 2022 | $6,301 | $340,400 | $117,400 | $223,000 |
| 2021 | $6,127 | $340,400 | $117,400 | $223,000 |
| 2020 | $6,015 | $289,600 | $117,400 | $172,200 |
| 2019 | $6,015 | $289,600 | $117,400 | $172,200 |
| 2018 | $5,876 | $289,600 | $117,400 | $172,200 |
| 2017 | $6,600 | $287,700 | $100,600 | $187,100 |
| 2016 | $6,459 | $287,700 | $100,600 | $187,100 |
| 2015 | $6,459 | $287,700 | $100,600 | $187,100 |
| 2014 | $6,206 | $271,700 | $96,400 | $175,300 |
Source: Public Records
Map
Nearby Homes
- 28 Hybrid Dr
- 10 Sheffield Rd
- 84 Intervale Rd
- 132 Fordson Ave Unit 12
- 446 Budlong Rd
- 38 Bridgton Rd
- 113 Fordson Ave
- 105 Fordson Ave
- 141 Glen Ridge Rd
- 34 Keller Ave
- 26 Keith Ave
- 46 Lilyana Way
- 275 Meshanticut Valley Pkwy
- 0 Rutland St
- 189 Poplar Dr
- 54 Salem Ave
- 99 Harvard St
- 38 Brettonwoods Dr
- 51 E Bel Air Rd
- 200 Hoffman Ave Unit 505