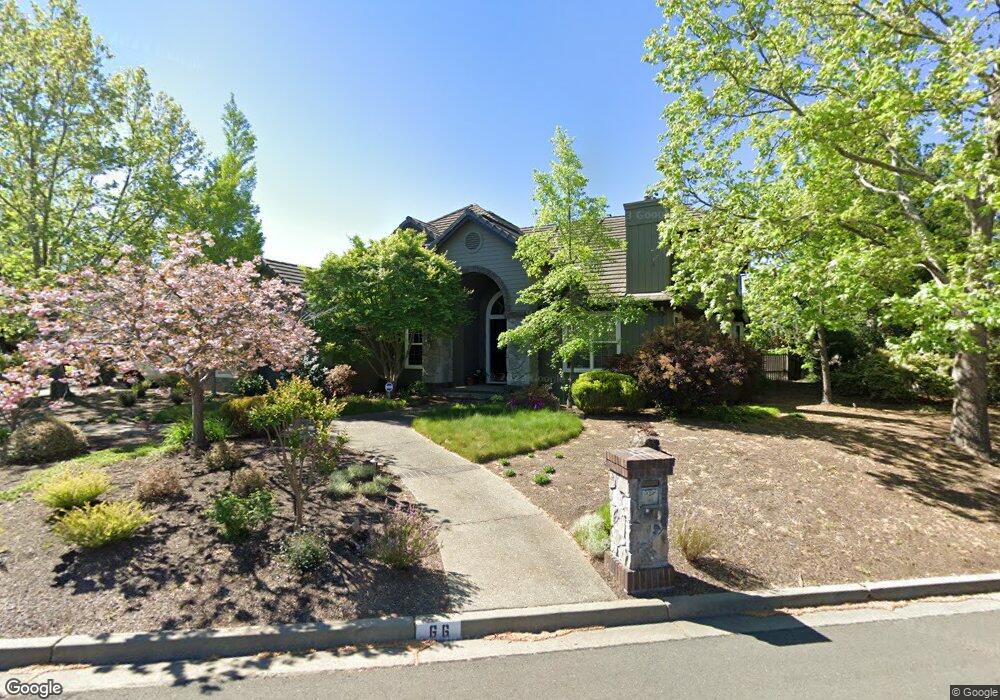
66 Meadow Walk Place Walnut Creek, CA 94598
Estimated Value: $2,319,000 - $2,706,000
4
Beds
4
Baths
3,835
Sq Ft
$668/Sq Ft
Est. Value
About This Home
This home is located at 66 Meadow Walk Place, Walnut Creek, CA 94598 and is currently estimated at $2,560,334, approximately $667 per square foot. 66 Meadow Walk Place is a home located in Contra Costa County with nearby schools including Valle Verde Elementary School, Foothill Middle School, and Northgate High School.
Ownership History
Date
Name
Owned For
Owner Type
Purchase Details
Closed on
Jul 31, 2009
Sold by
Pauling Timothy E and Pauling Lisa R
Bought by
Pauling Timothy E and Pauling Lisa R
Current Estimated Value
Purchase Details
Closed on
Feb 23, 1999
Sold by
Lyngaas John V and Noel Linda C
Bought by
Pauling Timothy E and Pauling Lisa R
Home Financials for this Owner
Home Financials are based on the most recent Mortgage that was taken out on this home.
Original Mortgage
$600,000
Outstanding Balance
$142,625
Interest Rate
6.79%
Mortgage Type
Purchase Money Mortgage
Estimated Equity
$2,417,709
Purchase Details
Closed on
Jul 2, 1996
Sold by
Smith Land & Development Co
Bought by
Lyngaas John and Noel Linda C
Home Financials for this Owner
Home Financials are based on the most recent Mortgage that was taken out on this home.
Original Mortgage
$585,500
Interest Rate
8.01%
Mortgage Type
Purchase Money Mortgage
Create a Home Valuation Report for This Property
The Home Valuation Report is an in-depth analysis detailing your home's value as well as a comparison with similar homes in the area
Home Values in the Area
Average Home Value in this Area
Purchase History
| Date | Buyer | Sale Price | Title Company |
|---|---|---|---|
| Pauling Timothy E | -- | None Available | |
| Pauling Timothy E | $830,000 | First American Title | |
| Lyngaas John | $265,000 | North American Title Co | |
| Smith Land & Development Co | -- | North American Title Co |
Source: Public Records
Mortgage History
| Date | Status | Borrower | Loan Amount |
|---|---|---|---|
| Open | Pauling Timothy E | $600,000 | |
| Previous Owner | Lyngaas John | $585,500 |
Source: Public Records
Tax History Compared to Growth
Tax History
| Year | Tax Paid | Tax Assessment Tax Assessment Total Assessment is a certain percentage of the fair market value that is determined by local assessors to be the total taxable value of land and additions on the property. | Land | Improvement |
|---|---|---|---|---|
| 2025 | $17,606 | $1,560,230 | $548,691 | $1,011,539 |
| 2024 | $17,606 | $1,529,638 | $537,933 | $991,705 |
| 2023 | $17,331 | $1,499,646 | $527,386 | $972,260 |
| 2022 | $17,179 | $1,470,243 | $517,046 | $953,197 |
| 2021 | $16,805 | $1,441,415 | $506,908 | $934,507 |
| 2019 | $16,485 | $1,398,664 | $491,874 | $906,790 |
| 2018 | $15,893 | $1,371,240 | $482,230 | $889,010 |
| 2017 | $15,401 | $1,344,354 | $472,775 | $871,579 |
| 2016 | $15,056 | $1,317,995 | $463,505 | $854,490 |
| 2015 | $17,674 | $1,298,198 | $456,543 | $841,655 |
| 2014 | $17,493 | $1,272,769 | $447,600 | $825,169 |
Source: Public Records
Map
Nearby Homes
- 460 Silver Hollow Dr
- 455 Kit Fox Ct
- 825 Bertram St
- 3158 Hambletonian Ln
- 1101 N Gate Rd
- 1206 N Gate Rd
- 2975 Hurlstone Ct
- 960 Maplegate Ct
- 165 Pine Creek Rd
- 110 Renwick Place
- 401 Pine Creek Rd
- 5295 Crystyl Ranch Dr
- 3638 Perada Dr
- 401 Seville Ln
- 206 Hamlin Loop
- 5391 Fernbank Dr
- 817 Cheyenne Dr
- 924 Cheyenne Dr
- 942 Cheyenne Dr
- 517 Heather Grove Ct
- 72 Meadow Walk Place
- 442 Silver Hollow Dr
- 448 Silver Hollow Dr
- 78 Meadow Walk Place
- 441 Silver Hollow Dr
- 67 Meadow Walk Place
- 73 Meadow Walk Place
- 431 Silver Hollow Dr
- 454 Silver Hollow Dr
- 79 Meadow Walk Place
- 84 Meadow Walk Place
- 424 Silver Hollow Dr
- 451 Silver Hollow Dr
- 85 Meadow Walk Place
- 421 Silver Hollow Dr
- 418 Silver Hollow Dr
- 4125 Arbolado Dr
- 461 Silver Hollow Dr
- 4115 Arbolado Dr
- 411 Silver Hollow Dr