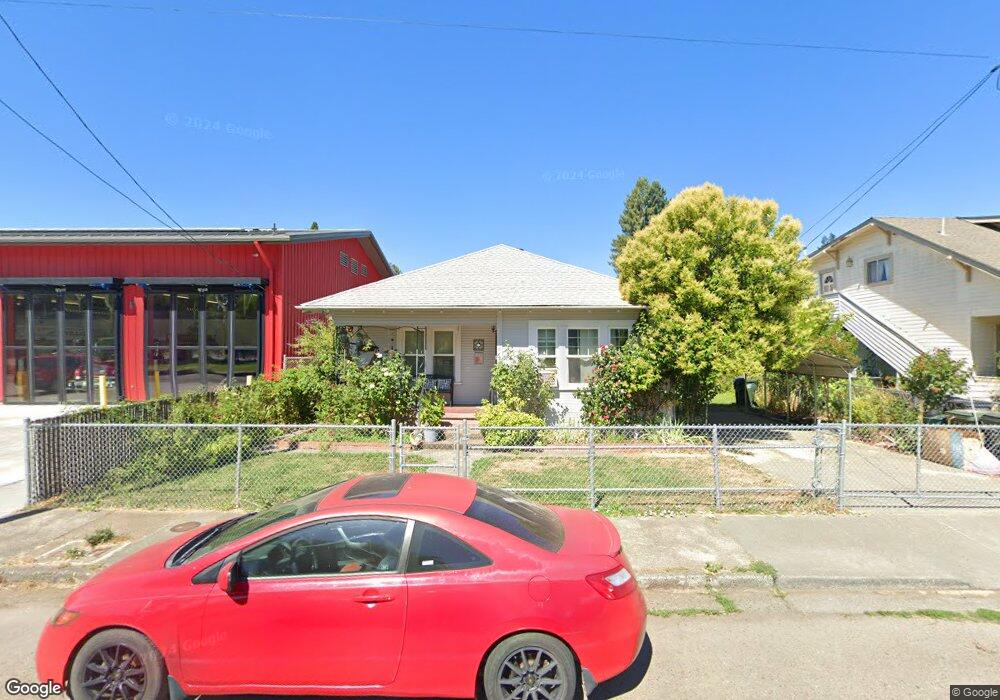
66 N Humboldt St Willits, CA 95490
Estimated Value: $286,000 - $456,000
--
Bed
--
Bath
--
Sq Ft
5,271
Sq Ft Lot
About This Home
This home is located at 66 N Humboldt St, Willits, CA 95490 and is currently estimated at $374,896. 66 N Humboldt St is a home located in Mendocino County with nearby schools including Brookside Elementary School, Blosser Lane Elementary School, and Baechtel Grove Middle School.
Ownership History
Date
Name
Owned For
Owner Type
Purchase Details
Closed on
Nov 15, 2010
Sold by
Pinches George E and Pinches Judy A
Bought by
Pinches George E and Pinches Judy A
Current Estimated Value
Purchase Details
Closed on
Nov 6, 2010
Sold by
Pinches Gary L and Pinches Cheryl J
Bought by
Pinches George E and Pinches Judy A
Purchase Details
Closed on
May 6, 2010
Sold by
Pinches Gary L and Pinches George E
Bought by
Pinches George E and Pinches Judy A
Purchase Details
Closed on
Apr 28, 2010
Sold by
Bridgers Jamie Lee
Bought by
Pinches Gary L and Pinches George E
Purchase Details
Closed on
Dec 7, 2009
Sold by
Pinches Gary L
Bought by
Pinches Gary Lee and Pinches Cheryl Joanne
Purchase Details
Closed on
Jan 6, 2009
Sold by
Pinches George E and Pinches Judy A
Bought by
Pinches George E and Pinches Judy A
Purchase Details
Closed on
Dec 17, 2002
Sold by
Pinches Mervin
Bought by
Pinches Gary L and Pinches George E
Create a Home Valuation Report for This Property
The Home Valuation Report is an in-depth analysis detailing your home's value as well as a comparison with similar homes in the area
Home Values in the Area
Average Home Value in this Area
Purchase History
| Date | Buyer | Sale Price | Title Company |
|---|---|---|---|
| Pinches George E | -- | None Available | |
| Pinches George E | -- | None Available | |
| Pinches George E | -- | None Available | |
| Pinches Gary L | $54,000 | None Available | |
| Pinches Gary Lee | -- | None Available | |
| Pinches George E | -- | None Available | |
| Pinches Gary L | -- | -- |
Source: Public Records
Tax History Compared to Growth
Tax History
| Year | Tax Paid | Tax Assessment Tax Assessment Total Assessment is a certain percentage of the fair market value that is determined by local assessors to be the total taxable value of land and additions on the property. | Land | Improvement |
|---|---|---|---|---|
| 2025 | $2,884 | $157,118 | $71,328 | $85,790 |
| 2023 | $2,884 | $151,018 | $68,559 | $82,459 |
| 2022 | $2,674 | $148,058 | $67,215 | $80,843 |
| 2021 | $2,661 | $145,156 | $65,898 | $79,258 |
| 2020 | $2,618 | $143,697 | $65,236 | $78,461 |
| 2019 | $2,616 | $140,879 | $63,957 | $76,922 |
| 2018 | $2,441 | $138,119 | $62,704 | $75,415 |
| 2017 | $2,353 | $135,411 | $61,474 | $73,937 |
| 2016 | $2,290 | $132,756 | $60,269 | $72,487 |
| 2015 | $2,265 | $130,763 | $59,364 | $71,399 |
| 2014 | $2,246 | $128,202 | $58,201 | $70,001 |
Source: Public Records
Map
Nearby Homes
- 258 State St
- 84 School St
- 36 Hillside Dr
- 308 Coast St
- 316 S Main St
- 98 Harms Ln
- 372 Coast St
- 155 California St
- 283 Sherwood Rd
- 25201 Sherwood Rd
- 25331 Sherwood Rd
- 307 Redwood Ave Unit 4
- 355 N Main St
- 288 E San Francisco Ave
- 134 Mill Creek Dr
- 611 Hawthorne Ln
- 555 Redwood Ave
- 458 E San Francisco Ave
- 755 Central Ave
- 80 Fort Bragg Rd