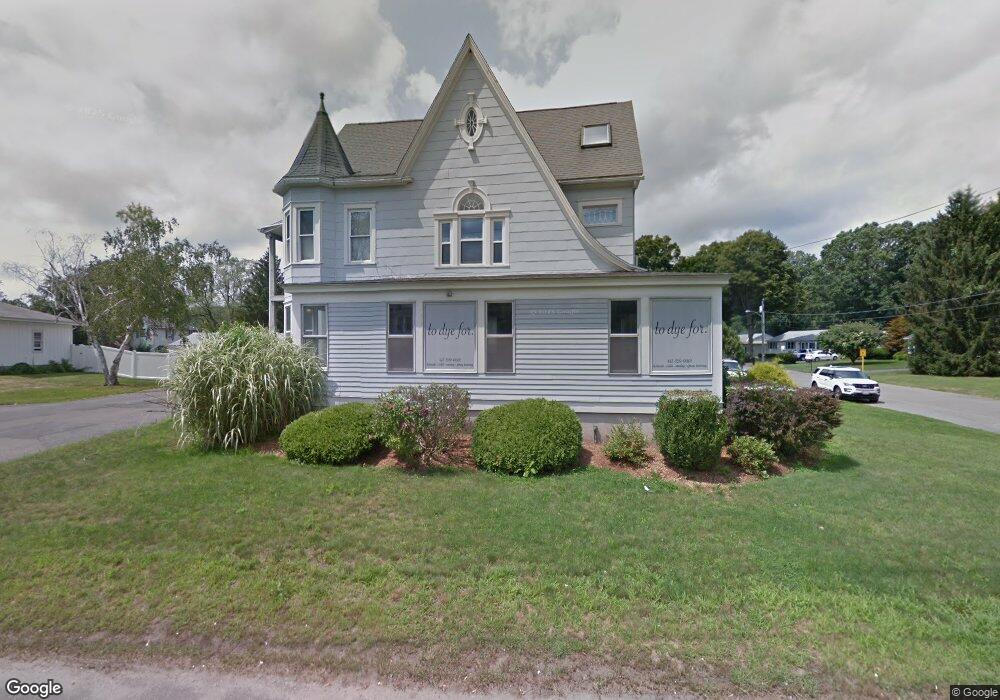
66 Northampton St Unit 1 Easthampton, MA 01027
Estimated Value: $984,078
--
Bed
--
Bath
1,000
Sq Ft
$984/Sq Ft
Est. Value
About This Home
This home is located at 66 Northampton St Unit 1, Easthampton, MA 01027 and is currently estimated at $984,078, approximately $984 per square foot. 66 Northampton St Unit 1 is a home located in Hampshire County with nearby schools including Easthampton High School, Hilltown Cooperative Charter Public School, and Calvary Baptist Christian School.
Ownership History
Date
Name
Owned For
Owner Type
Purchase Details
Closed on
Dec 7, 2012
Sold by
Chase Ent Corp
Bought by
Duprey Nicholas D and Duprey Betty L
Current Estimated Value
Home Financials for this Owner
Home Financials are based on the most recent Mortgage that was taken out on this home.
Original Mortgage
$342,000
Outstanding Balance
$237,952
Interest Rate
3.46%
Mortgage Type
Commercial
Estimated Equity
$746,126
Purchase Details
Closed on
Jun 29, 2007
Sold by
Peoples Sb
Bought by
Chase Enterprises Corp
Purchase Details
Closed on
Oct 20, 1994
Sold by
Hebert Dennis and Hebert Donna
Bought by
Digrigoli Linda and Digrigoli Paul
Home Financials for this Owner
Home Financials are based on the most recent Mortgage that was taken out on this home.
Original Mortgage
$240,000
Interest Rate
8.49%
Mortgage Type
Commercial
Create a Home Valuation Report for This Property
The Home Valuation Report is an in-depth analysis detailing your home's value as well as a comparison with similar homes in the area
Home Values in the Area
Average Home Value in this Area
Purchase History
| Date | Buyer | Sale Price | Title Company |
|---|---|---|---|
| Duprey Nicholas D | $427,500 | -- | |
| Chase Enterprises Corp | $370,000 | -- | |
| Chase Enterprises Corp | $370,000 | -- | |
| Digrigoli Linda | $127,500 | -- | |
| Digrigoli Linda | $127,500 | -- |
Source: Public Records
Mortgage History
| Date | Status | Borrower | Loan Amount |
|---|---|---|---|
| Open | Duprey Nicholas D | $342,000 | |
| Closed | Digrigoli Linda | $342,000 | |
| Previous Owner | Digrigoli Linda | $150,000 | |
| Previous Owner | Digrigoli Linda | $225,000 | |
| Previous Owner | Digrigoli Linda | $240,000 |
Source: Public Records
Tax History Compared to Growth
Tax History
| Year | Tax Paid | Tax Assessment Tax Assessment Total Assessment is a certain percentage of the fair market value that is determined by local assessors to be the total taxable value of land and additions on the property. | Land | Improvement |
|---|---|---|---|---|
| 2025 | $7,482 | $547,300 | $152,300 | $395,000 |
| 2024 | $7,213 | $531,900 | $148,000 | $383,900 |
| 2023 | $6,660 | $454,600 | $130,100 | $324,500 |
| 2022 | $7,515 | $454,600 | $130,100 | $324,500 |
| 2021 | $8,568 | $454,600 | $130,100 | $324,500 |
| 2020 | $8,074 | $454,600 | $130,100 | $324,500 |
| 2019 | $6,682 | $432,200 | $130,100 | $302,100 |
| 2018 | $6,501 | $406,300 | $122,700 | $283,600 |
| 2017 | $6,328 | $390,400 | $118,000 | $272,400 |
| 2016 | $6,086 | $390,400 | $118,000 | $272,400 |
| 2015 | $5,915 | $390,400 | $118,000 | $272,400 |
Source: Public Records
Map
Nearby Homes
- 26 Colonial Ave Unit 26
- 38 West St
- 33 Howard Ave
- 19 Nicols Way Unit 19
- 117-119 Union St
- 157 Pleasant St Unit 159
- 5 Grant St Unit 5
- 52-54 Everett St
- 2 Little St
- 34 Briggs St
- 98 Everett St
- 12 Glen Cove Place Unit B
- 10 Glen Cove Place Unit A
- M143 &152 Glendale St
- 6 Newell St
- 385 Main St
- 125 Park St
- 5 Laurin Ln
- 5 Lownds Ave
- 20 Pomeroy Meadow Rd
- 66 Northampton St Unit 68
- 66-68 Northampton St
- 66 Northampton St Unit 66 A Northampton Str
- 66 Northampton St Unit 66 B Northampton Str
- 68 Northampton St Unit 2
- 68 Northampton St Unit 1+2
- 68 Northampton St
- 65 Northampton St
- 62 Northampton St
- 4 Dragon Cir
- 63 Northampton St
- 61 Northampton St
- 72 Northampton St
- 71 Northampton St
- 3 Dragon Cir
- 28 Dragon Cir
- 74 Northampton St
- 6 Dragon Cir
- 75 Northampton St
- 5 Dragon Cir