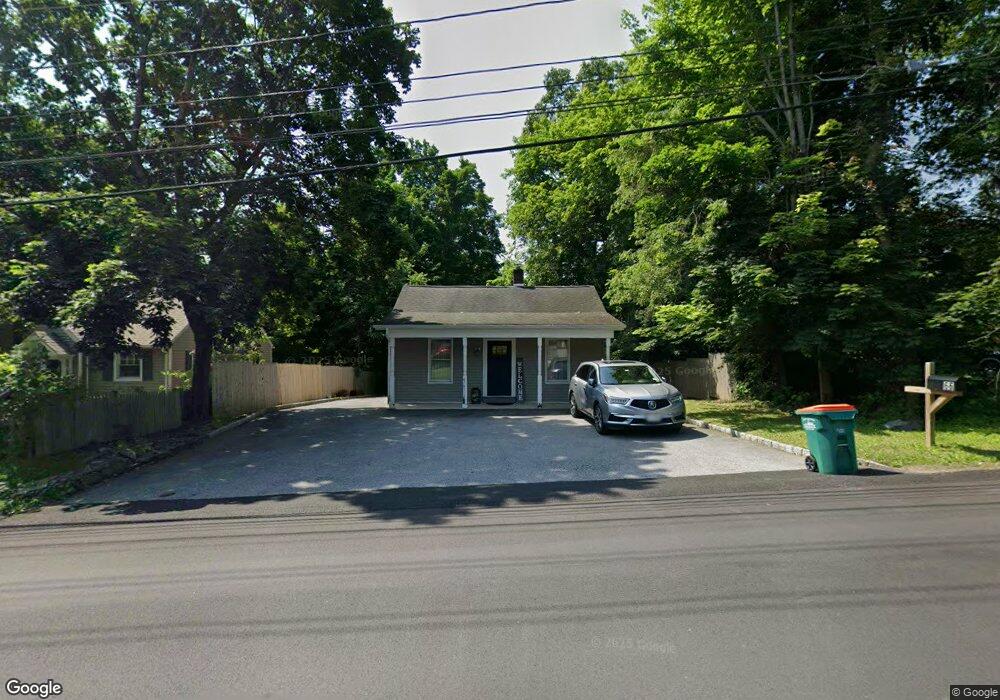
66 Pendell Rd Poughkeepsie, NY 12601
Estimated Value: $289,000 - $341,000
2
Beds
2
Baths
1,100
Sq Ft
$293/Sq Ft
Est. Value
About This Home
This home is located at 66 Pendell Rd, Poughkeepsie, NY 12601 and is currently estimated at $322,326, approximately $293 per square foot. 66 Pendell Rd is a home located in Dutchess County with nearby schools including Franklin D Roosevelt Senior High School, Faith Christian Academy, and Tabernacle Christian Academy.
Ownership History
Date
Name
Owned For
Owner Type
Purchase Details
Closed on
Aug 19, 2005
Sold by
Trust 5Pw
Bought by
Dicorcia Mark
Current Estimated Value
Home Financials for this Owner
Home Financials are based on the most recent Mortgage that was taken out on this home.
Original Mortgage
$148,400
Outstanding Balance
$24,225
Interest Rate
5.84%
Mortgage Type
Purchase Money Mortgage
Estimated Equity
$298,101
Purchase Details
Closed on
Apr 18, 2000
Sold by
Page Susan Page
Bought by
Wilder Susan Page
Create a Home Valuation Report for This Property
The Home Valuation Report is an in-depth analysis detailing your home's value as well as a comparison with similar homes in the area
Home Values in the Area
Average Home Value in this Area
Purchase History
| Date | Buyer | Sale Price | Title Company |
|---|---|---|---|
| Dicorcia Mark | $153,000 | Thomas Kelly | |
| Wilder Susan Page | -- | -- |
Source: Public Records
Mortgage History
| Date | Status | Borrower | Loan Amount |
|---|---|---|---|
| Open | Dicorcia Mark | $148,400 |
Source: Public Records
Tax History
| Year | Tax Paid | Tax Assessment Tax Assessment Total Assessment is a certain percentage of the fair market value that is determined by local assessors to be the total taxable value of land and additions on the property. | Land | Improvement |
|---|---|---|---|---|
| 2024 | $8,798 | $262,000 | $59,400 | $202,600 |
| 2023 | $10,051 | $262,000 | $59,400 | $202,600 |
| 2019 | $5,698 | $157,500 | $54,000 | $103,500 |
Source: Public Records
Map
Nearby Homes
Your Personal Tour Guide
Ask me questions while you tour the home.