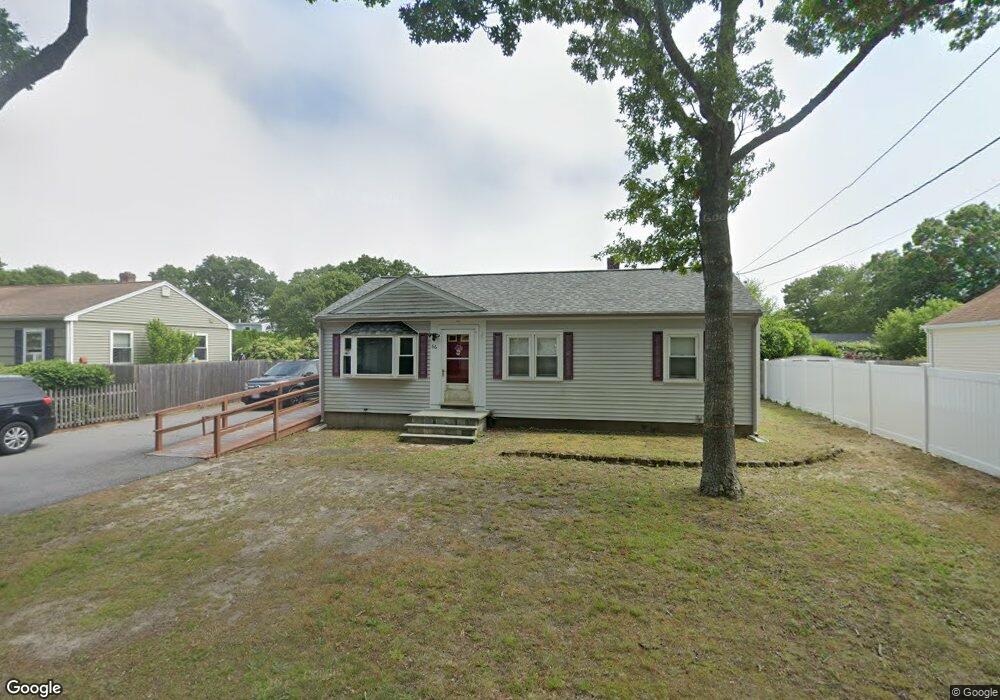
66 Ryder St Buzzards Bay, MA 02532
Wareham AreaEstimated Value: $427,331 - $472,000
3
Beds
1
Bath
1,182
Sq Ft
$382/Sq Ft
Est. Value
About This Home
This home is located at 66 Ryder St, Buzzards Bay, MA 02532 and is currently estimated at $451,583, approximately $382 per square foot. 66 Ryder St is a home.
Ownership History
We collect this data history from publicly available records. To have your information removed, we recommend requesting removal directly through your county’s website.
Date
Name
Owned For
Owner Type
Purchase Details
Closed on
Aug 26, 2005
Sold by
Bought by
Current Estimated Value
Purchase Details
Closed on
Feb 24, 2005
Sold by
Bought by
Create a Home Valuation Report for This Property
The Home Valuation Report is an in-depth analysis detailing your home's value as well as a comparison with similar homes in the area
Purchase History
We collect this data history from publicly available records. To have your information removed, we recommend requesting removal directly through your county’s website.
| Date | Buyer | Sale Price | Title Company |
|---|---|---|---|
| $281,900 | -- | ||
| $209,500 | -- |
Source: Public Records
Tax History
We collect this data history from publicly available records. To have your information removed, we recommend requesting removal directly through your county’s website.
| Year | Tax Paid | Tax Assessment Tax Assessment Total Assessment is a certain percentage of the fair market value that is determined by local assessors to be the total taxable value of land and additions on the property. | Land | Improvement |
|---|---|---|---|---|
| 2025 | $3,872 | $352,600 | $117,500 | $235,100 |
| 2024 | $3,822 | $327,200 | $90,800 | $236,400 |
| 2023 | $3,461 | $294,000 | $82,500 | $211,500 |
| 2022 | $3,461 | $254,100 | $82,500 | $171,600 |
| 2021 | $3,454 | $246,700 | $82,500 | $164,200 |
| 2020 | $3,211 | $234,200 | $82,500 | $151,700 |
| 2019 | $2,827 | $208,500 | $76,600 | $131,900 |
| 2018 | $2,693 | $191,800 | $76,600 | $115,200 |
| 2017 | $2,515 | $179,900 | $76,600 | $103,300 |
| 2016 | $2,284 | $162,100 | $73,200 | $88,900 |
| 2015 | $2,221 | $162,100 | $73,200 | $88,900 |
| 2014 | $2,209 | $166,200 | $73,200 | $93,000 |
Source: Public Records
Map
Nearby Homes
- 60 Martin St
- 8 Oakmont Dr Unit 8
- 22 Long Neck Rd
- 38 Cahoon Rd Unit 38
- 4 Onset Ave
- 56 Rip Van Winkle Way
- 8 Ash St
- 10 Cleveland Ave
- 10 Cleveland Ave
- 2 Stone Dr
- 7 Buzzards Bay Dr
- 109 Packard St
- 51 Cypress St
- 36B Starboard Dr Unit C
- 36B Starboard Dr Unit A
- 36B Starboard Dr Unit B
- 5 Upland Rd
- 3 Short Neck Rd
- 4 Van Bummel Rd
- 3040 Cranberry Hwy Unit 32
Your Personal Tour Guide
Ask me questions while you tour the home.