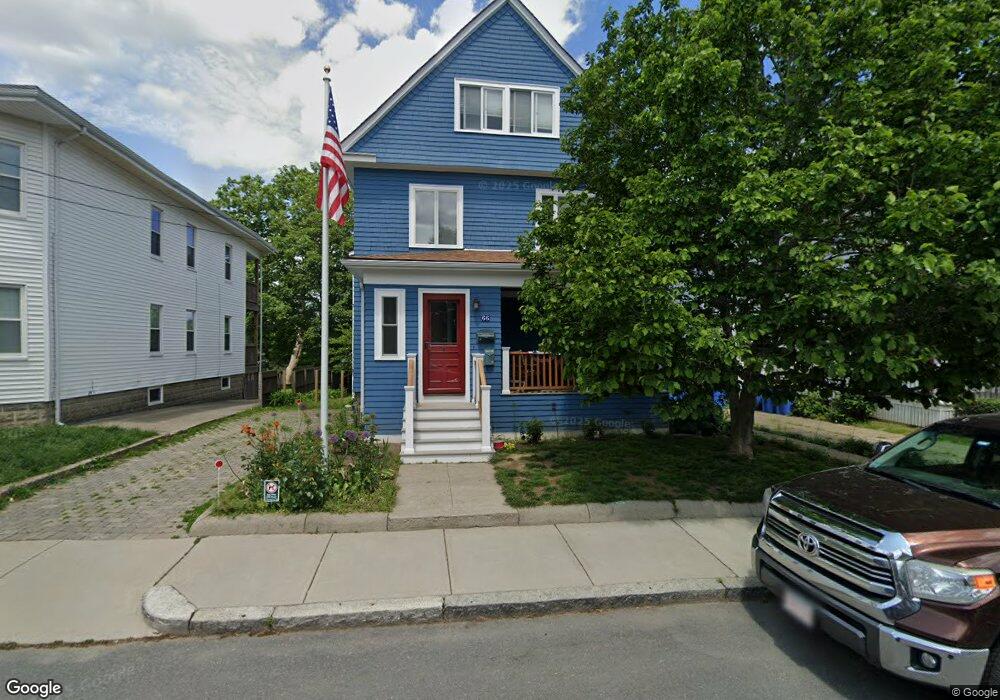
66 Summit Ave Unit 1 Winthrop, MA 02152
Downtown Winthrop NeighborhoodEstimated Value: $714,000 - $897,028
1
Bed
1
Bath
450
Sq Ft
$1,840/Sq Ft
Est. Value
About This Home
This home is located at 66 Summit Ave Unit 1, Winthrop, MA 02152 and is currently estimated at $828,007, approximately $1,840 per square foot. 66 Summit Ave Unit 1 is a home located in Suffolk County with nearby schools including William P. Gorman/Fort Banks Elementary School, Arthur T. Cummings Elementary School, and Winthrop Middle School.
Ownership History
Date
Name
Owned For
Owner Type
Purchase Details
Closed on
May 21, 2021
Sold by
Indeck Jeffrey W and Indeck Rosalie A
Bought by
Indeck Jeffrey W
Current Estimated Value
Home Financials for this Owner
Home Financials are based on the most recent Mortgage that was taken out on this home.
Original Mortgage
$350,000
Outstanding Balance
$316,008
Interest Rate
3%
Mortgage Type
New Conventional
Estimated Equity
$511,999
Purchase Details
Closed on
Aug 15, 2016
Sold by
Farchione Todd and Farchione Eleana
Bought by
Indeck Jeffrey W and Indeck Rosalie A
Home Financials for this Owner
Home Financials are based on the most recent Mortgage that was taken out on this home.
Original Mortgage
$200,000
Interest Rate
2.78%
Mortgage Type
New Conventional
Purchase Details
Closed on
Jun 10, 2011
Sold by
Settipane Danielle and Settipane John J
Bought by
Farchione Todd and Farchione Eleana
Purchase Details
Closed on
May 25, 2011
Sold by
Curran Paul J
Bought by
Settipane John J and Settipane Danielle
Purchase Details
Closed on
Sep 21, 2004
Sold by
Indeck Jeffrey W
Bought by
Settipane Danielle and Settipane John J
Purchase Details
Closed on
Nov 15, 1999
Sold by
Rubin Irwin J
Bought by
Indeck Jeffrey W
Create a Home Valuation Report for This Property
The Home Valuation Report is an in-depth analysis detailing your home's value as well as a comparison with similar homes in the area
Home Values in the Area
Average Home Value in this Area
Purchase History
| Date | Buyer | Sale Price | Title Company |
|---|---|---|---|
| Indeck Jeffrey W | -- | None Available | |
| Indeck Jeffrey W | -- | None Available | |
| Indeck Jeffrey W | $529,000 | -- | |
| Farchione Todd | $412,500 | -- | |
| Farchione Todd | $412,500 | -- | |
| Settipane John J | -- | -- | |
| Settipane John J | -- | -- | |
| Settipane Danielle | $510,000 | -- | |
| Settipane Danielle | $510,000 | -- | |
| Indeck Jeffrey W | $232,500 | -- | |
| Indeck Jeffrey W | $232,500 | -- |
Source: Public Records
Mortgage History
| Date | Status | Borrower | Loan Amount |
|---|---|---|---|
| Open | Indeck Jeffrey W | $350,000 | |
| Closed | Indeck Jeffrey W | $350,000 | |
| Previous Owner | Indeck Jeffrey W | $200,000 |
Source: Public Records
Tax History Compared to Growth
Tax History
| Year | Tax Paid | Tax Assessment Tax Assessment Total Assessment is a certain percentage of the fair market value that is determined by local assessors to be the total taxable value of land and additions on the property. | Land | Improvement |
|---|---|---|---|---|
| 2025 | $8,398 | $813,800 | $337,100 | $476,700 |
| 2024 | $8,060 | $773,500 | $324,000 | $449,500 |
| 2023 | $8,284 | $774,200 | $296,500 | $477,700 |
| 2022 | $8,160 | $693,900 | $264,900 | $429,000 |
| 2021 | $7,993 | $630,400 | $236,500 | $393,900 |
| 2020 | $7,784 | $616,800 | $236,500 | $380,300 |
| 2019 | $7,672 | $582,100 | $218,000 | $364,100 |
| 2018 | $7,499 | $529,600 | $187,100 | $342,500 |
| 2017 | $6,853 | $475,600 | $165,600 | $310,000 |
| 2016 | $6,521 | $424,300 | $144,000 | $280,300 |
| 2015 | $5,792 | $403,900 | $139,800 | $264,100 |
| 2014 | $5,592 | $358,900 | $130,000 | $228,900 |
Source: Public Records
Map
Nearby Homes
- 41 Summit Ave
- 80 Shirley St
- 249 Winthrop Shore Dr Unit 6
- 130 Shirley St Unit 204
- 130 Shirley St Unit 202
- 10 Beach Rd Unit 1
- 5 Quincy Ave
- 144 Quincy Ave
- 800 Governors Dr Unit 6
- 1100 Governors Dr Unit 6
- 800 Governors Dr Unit 30
- 1000 Governors Dr Unit 25
- 2 Deane Ave
- 441 Winthrop St
- 426 Winthrop St
- 50-52 Wilshire St
- 23 Trident Ave Unit 2
- 53 Trident Ave Unit 103
- 53 Trident Ave Unit 303
- 37 Trident Ave
- 66 Summit Ave
- 70 Summit Ave
- 70 Summit Ave Unit 1
- 70 Summit Ave Unit 2
- 62 Summit Ave Unit 64
- 62 Summit Ave Unit 2
- 58 Summit Ave
- 59 Sagamore Ave
- 65 Sagamore Ave
- 76 Summit Ave
- 69 Summit Ave Unit 2
- 69 Summit Ave
- 69 Summit Ave Unit 1
- 69 Summit Ave Unit B
- 63 Summit Ave
- 63 Summit Ave
- 50 Summit Ave Unit 52
- 80 Summit Ave
- 59 Summit Ave
- 55 Sagamore Ave