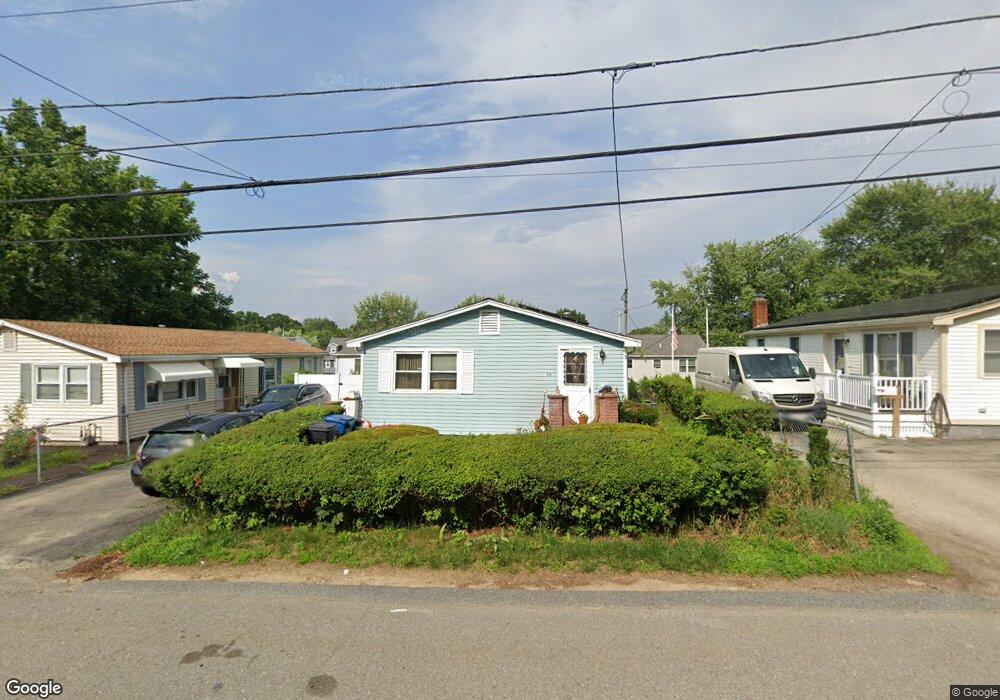
66 Thornton St Lawrence, MA 01841
Prospect Hill-Back Bay NeighborhoodEstimated Value: $517,000 - $568,000
3
Beds
2
Baths
1,056
Sq Ft
$508/Sq Ft
Est. Value
About This Home
This home is located at 66 Thornton St, Lawrence, MA 01841 and is currently estimated at $536,783, approximately $508 per square foot. 66 Thornton St is a home located in Essex County with nearby schools including School For Exceptional Studies, Community Day Charter Public School - Gateway, and Esperanza Academy School of Hope.
Ownership History
Date
Name
Owned For
Owner Type
Purchase Details
Closed on
Jun 3, 2002
Sold by
Camargo Leonor
Bought by
Ruiz Jaun Ronald and Ruiz Rocio
Current Estimated Value
Home Financials for this Owner
Home Financials are based on the most recent Mortgage that was taken out on this home.
Original Mortgage
$25,000
Interest Rate
6.92%
Create a Home Valuation Report for This Property
The Home Valuation Report is an in-depth analysis detailing your home's value as well as a comparison with similar homes in the area
Home Values in the Area
Average Home Value in this Area
Purchase History
We collect this data history from publicly available records. To have your information removed, we recommend requesting removal directly through your county’s website.
| Date | Buyer | Sale Price | Title Company |
|---|---|---|---|
| Ruiz Jaun Ronald | $125,000 | -- |
Source: Public Records
Mortgage History
We collect this data history from publicly available records. To have your information removed, we recommend requesting removal directly through your county’s website.
| Date | Status | Borrower | Loan Amount |
|---|---|---|---|
| Open | Ruiz Jaun Ronald | $120,000 | |
| Closed | Ruiz Jaun Ronald | $25,000 |
Source: Public Records
Tax History
| Year | Tax Paid | Tax Assessment Tax Assessment Total Assessment is a certain percentage of the fair market value that is determined by local assessors to be the total taxable value of land and additions on the property. | Land | Improvement |
|---|---|---|---|---|
| 2025 | $3,822 | $434,300 | $137,600 | $296,700 |
| 2024 | $3,608 | $390,100 | $120,900 | $269,200 |
| 2023 | $3,685 | $362,700 | $110,100 | $252,600 |
| 2022 | $3,626 | $317,000 | $104,200 | $212,800 |
| 2021 | $3,434 | $279,900 | $104,200 | $175,700 |
| 2020 | $3,479 | $279,900 | $104,200 | $175,700 |
| 2019 | $3,305 | $241,600 | $81,800 | $159,800 |
| 2018 | $3,245 | $226,600 | $80,200 | $146,400 |
| 2017 | $2,939 | $191,600 | $73,800 | $117,800 |
| 2016 | $3,037 | $195,800 | $69,700 | $126,100 |
| 2015 | $2,960 | $195,800 | $69,700 | $126,100 |
Source: Public Records
Map
Nearby Homes
- 264 E Haverhill St Unit 2
- 264 E Haverhill St Unit 4
- 7 Erhardt Terrace
- 10 Gloucester St
- 106 E Haverhill St
- 31 Dexter St
- 1 Riverview Blvd Unit 1-216
- 128 East St
- 229 Jackson St
- 20 Montgomery St
- 83-87 Howard St
- 84 Howard St
- 70 Marston St
- 15 Bunkerhill St
- 1 Lady Slipper Ln
- 3 Lady Slipper Ln
- 281 Essex St Unit 285
- 58 Oakcrest Cir
- 16 Hartung St
- 86 Comet Rd
- 68 Thorton St
- 68 Thornton St
- 64 Thornton St
- 83 Thornton St Unit 85
- 54 Rollins St
- 52 Rollins St
- 60 Thornton St
- 79 Thornton St Unit 81
- 83-85 Thornton St
- 87 Thornton St Unit 89
- 75 Thornton St Unit 77
- 58 Rollins St
- 71 Thornton St Unit 73
- 73 Thornton St Unit 73
- 73 Thornton St
- 73 Thornton St Unit 1
- 71 William St
- 96 Thornton St
- 93 Thornton St
- 69 Wesley St
Your Personal Tour Guide
Ask me questions while you tour the home.