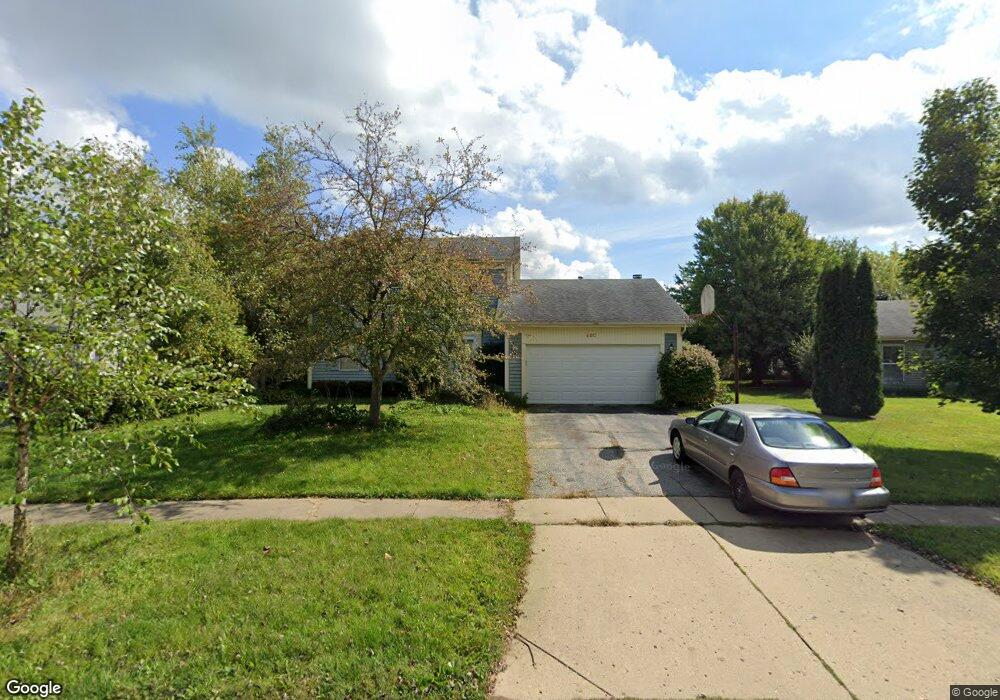
660 Claymont Ct Algonquin, IL 60102
Estimated Value: $356,000 - $372,693
3
Beds
2
Baths
1,725
Sq Ft
$211/Sq Ft
Est. Value
About This Home
This home is located at 660 Claymont Ct, Algonquin, IL 60102 and is currently estimated at $364,673, approximately $211 per square foot. 660 Claymont Ct is a home located in McHenry County with nearby schools including Algonquin Lakes Elementary School, Algonquin Middle School, and Dundee-Crown High School.
Ownership History
Date
Name
Owned For
Owner Type
Purchase Details
Closed on
Feb 21, 2023
Sold by
Mcclendon Delmas
Bought by
Mcclendon Carolyn
Current Estimated Value
Purchase Details
Closed on
Apr 27, 2005
Sold by
Spong Charles W and Spong Sara C
Bought by
Mcclendon Delmas C and Mcclendon Carolyn
Home Financials for this Owner
Home Financials are based on the most recent Mortgage that was taken out on this home.
Original Mortgage
$194,300
Interest Rate
5.5%
Mortgage Type
Unknown
Purchase Details
Closed on
Jul 13, 2000
Sold by
Kerkman Douglas J and Kerkman Polly B
Bought by
Spong Ii Charles W and Spong Sara C
Home Financials for this Owner
Home Financials are based on the most recent Mortgage that was taken out on this home.
Original Mortgage
$136,000
Interest Rate
7.87%
Create a Home Valuation Report for This Property
The Home Valuation Report is an in-depth analysis detailing your home's value as well as a comparison with similar homes in the area
Home Values in the Area
Average Home Value in this Area
Purchase History
| Date | Buyer | Sale Price | Title Company |
|---|---|---|---|
| Mcclendon Carolyn | -- | None Listed On Document | |
| Mcclendon Delmas C | $242,900 | First American Title | |
| Spong Ii Charles W | $170,000 | Chicago Title Insurance Co |
Source: Public Records
Mortgage History
| Date | Status | Borrower | Loan Amount |
|---|---|---|---|
| Previous Owner | Mcclendon Delmas C | $194,300 | |
| Previous Owner | Spong Ii Charles W | $136,000 | |
| Closed | Spong Ii Charles W | $8,500 |
Source: Public Records
Tax History Compared to Growth
Tax History
| Year | Tax Paid | Tax Assessment Tax Assessment Total Assessment is a certain percentage of the fair market value that is determined by local assessors to be the total taxable value of land and additions on the property. | Land | Improvement |
|---|---|---|---|---|
| 2024 | $7,934 | $117,417 | $22,231 | $95,186 |
| 2023 | $7,452 | $105,015 | $19,883 | $85,132 |
| 2022 | $6,100 | $82,127 | $20,766 | $61,361 |
| 2021 | $5,813 | $76,511 | $19,346 | $57,165 |
| 2020 | $5,639 | $73,802 | $18,661 | $55,141 |
| 2019 | $5,476 | $70,638 | $17,861 | $52,777 |
| 2018 | $5,631 | $70,081 | $16,486 | $53,595 |
| 2017 | $5,479 | $66,021 | $15,531 | $50,490 |
| 2016 | $5,355 | $61,922 | $14,567 | $47,355 |
| 2013 | -- | $58,015 | $13,589 | $44,426 |
Source: Public Records
Map
Nearby Homes
- 1730 Tanglewood Dr
- 2008 Clematis Dr
- 620 Old Oak Cir
- 1011 Wesley Ln
- 920 Plymouth Ct
- 903 Old Oak Cir
- 911 Old Oak Cir Unit 1
- 14 Oxford Ct
- 1188 E Algonquin Rd
- 1659 E Algonquin Rd
- 925 N River Rd
- 1439 Lowe Dr
- 1770 E Algonquin Rd
- Lot 4 b Ryan Pkwy
- 1782 Cumberland Pkwy
- 2 Cumberland Pkwy
- 2 Sunset Ln
- 1943 Ozark Pkwy
- 600 E Algonquin Rd
- 69 Alice St
- 680 Claymont Ct
- 640 Claymont Ct
- 655 Fox Run Ln
- 675 Fox Run Ln
- 695 Fox Run Ln
- 710 Claymont Ct
- 715 Fox Run Ln
- 635 Fox Run Ln
- 1575 Powder Horn Dr
- 1605 Powder Horn Dr
- 735 Fox Run Ln
- 603 Claymont Ct
- 607 Claymont Ct
- 730 Claymont Ct Unit 3
- 1625 Powder Horn Dr
- 1535 Powder Horn Dr
- 755 Fox Run Ln
- 608 Claymont Ct Unit 3
- 1515 Powder Horn Dr
- 680 Fox Run Ln