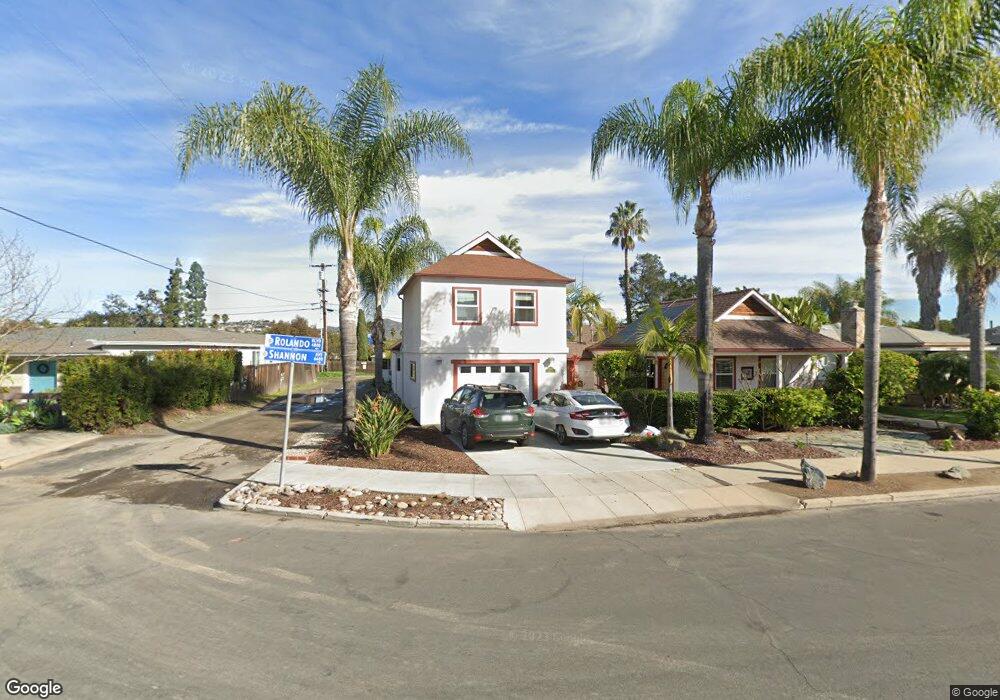
6600 Shannon Ave San Diego, CA 92115
Rolando NeighborhoodEstimated Value: $1,278,000 - $1,386,000
4
Beds
3
Baths
2,417
Sq Ft
$551/Sq Ft
Est. Value
About This Home
This home is located at 6600 Shannon Ave, San Diego, CA 92115 and is currently estimated at $1,332,316, approximately $551 per square foot. 6600 Shannon Ave is a home located in San Diego County with nearby schools including Clay Elementary School, Mann Middle School, and Crawford High School.
Ownership History
Date
Name
Owned For
Owner Type
Purchase Details
Closed on
Jun 25, 2015
Sold by
Moore Jason and Shainfeld Dori
Bought by
Rennie Family Trust and Rennie Kristy
Current Estimated Value
Home Financials for this Owner
Home Financials are based on the most recent Mortgage that was taken out on this home.
Original Mortgage
$496,000
Outstanding Balance
$385,531
Interest Rate
3.85%
Mortgage Type
New Conventional
Estimated Equity
$946,785
Purchase Details
Closed on
Sep 20, 2011
Sold by
Gabhart Real Estate Opportunity Fund Llc
Bought by
Moore Jason and Shainfeld Dori
Home Financials for this Owner
Home Financials are based on the most recent Mortgage that was taken out on this home.
Original Mortgage
$487,227
Interest Rate
4.25%
Mortgage Type
FHA
Purchase Details
Closed on
Nov 15, 2010
Sold by
Morequity Inc
Bought by
Gabhart Real Estate Opportunity Fund Llc
Purchase Details
Closed on
Aug 27, 2010
Sold by
Lakely John and Lakely Maile K
Bought by
Morequity Inc
Purchase Details
Closed on
Nov 11, 2009
Sold by
Lakely Maile K
Bought by
Lakely John
Purchase Details
Closed on
Jun 2, 1988
Create a Home Valuation Report for This Property
The Home Valuation Report is an in-depth analysis detailing your home's value as well as a comparison with similar homes in the area
Home Values in the Area
Average Home Value in this Area
Purchase History
| Date | Buyer | Sale Price | Title Company |
|---|---|---|---|
| Rennie Family Trust | $620,000 | Title 365 | |
| Moore Jason | $500,000 | Fidelity National Title San | |
| Gabhart Real Estate Opportunity Fund Llc | $325,000 | Lsi Title Company | |
| Morequity Inc | $360,000 | Accommodation | |
| Lakely John | -- | None Available | |
| -- | $91,000 | -- |
Source: Public Records
Mortgage History
| Date | Status | Borrower | Loan Amount |
|---|---|---|---|
| Open | Rennie Family Trust | $496,000 | |
| Previous Owner | Moore Jason | $487,227 |
Source: Public Records
Tax History Compared to Growth
Tax History
| Year | Tax Paid | Tax Assessment Tax Assessment Total Assessment is a certain percentage of the fair market value that is determined by local assessors to be the total taxable value of land and additions on the property. | Land | Improvement |
|---|---|---|---|---|
| 2025 | $8,817 | $733,947 | $384,729 | $349,218 |
| 2024 | $8,817 | $719,557 | $377,186 | $342,371 |
| 2023 | $8,619 | $705,449 | $369,791 | $335,658 |
| 2022 | $8,388 | $691,618 | $362,541 | $329,077 |
| 2021 | $8,328 | $678,058 | $355,433 | $322,625 |
| 2020 | $8,226 | $671,106 | $351,789 | $319,317 |
| 2019 | $8,078 | $657,948 | $344,892 | $313,056 |
| 2018 | $7,552 | $645,048 | $338,130 | $306,918 |
| 2017 | $7,371 | $632,400 | $331,500 | $300,900 |
| 2016 | $7,251 | $620,000 | $325,000 | $295,000 |
| 2015 | $6,107 | $522,444 | $277,159 | $245,285 |
| 2014 | -- | $512,211 | $271,730 | $240,481 |
Source: Public Records
Map
Nearby Homes
- 4805 Rolando Blvd
- 6650 Amherst St Unit 14A
- 4783 Lenore Dr
- 6735 Amherst St
- 4860 Rolando Ct Unit 52
- 4860 Rolando Ct Unit 25
- 4860 Rolando Ct Unit 42
- 4860 Rolando Ct Unit 29
- 4860 Rolando Ct Unit 81
- 4844 68th St Unit 14
- 4672 Rolando Blvd
- 6615 Reservoir Ct
- 4777 Seminole Dr Unit 118
- 6752 Solita Ave
- 6486 Montezuma Rd
- 5092 Catoctin Dr
- 6891 Eberhart St
- 4727 Choctaw Dr
- 6926-28 Amherst St
- 6927 Amherst St Unit 3
- 6606 Shannon Ave
- 4801 Rolando Blvd
- 6610 Shannon Ave
- 6665 Amherst St
- 6669 Amherst St
- 6661 Amherst St
- 6620 Shannon Ave
- 4796 Valencia Dr
- 4809 Rolando Blvd
- 4797 Rolando Blvd
- 6657 Amherst St
- 4784 Valencia Dr
- 6673 Amherst St Unit 75
- 4787 Valencia Dr
- 6630 Shannon Ave
- 6653 Amherst St
- 4811 Rolando Blvd
- 4789 Rolando Blvd
- 4778 Valencia Dr
- 6649 Amherst St