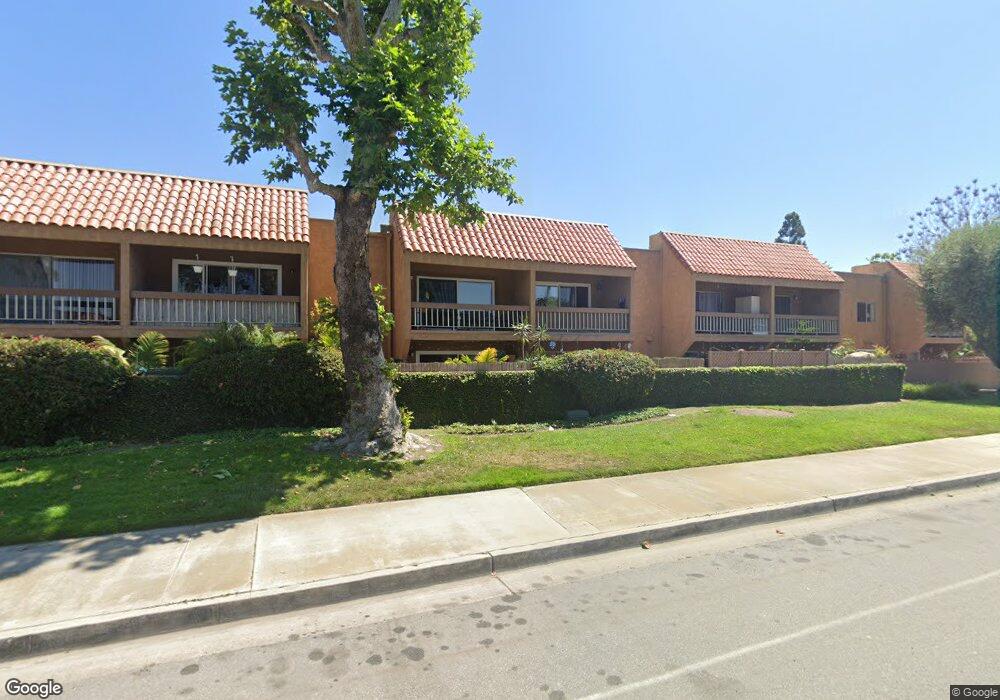
6600 Warner Ave Unit 114 Huntington Beach, CA 92647
Goldenwest NeighborhoodEstimated Value: $560,049 - $609,000
2
Beds
2
Baths
1,110
Sq Ft
$526/Sq Ft
Est. Value
About This Home
This home is located at 6600 Warner Ave Unit 114, Huntington Beach, CA 92647 and is currently estimated at $583,512, approximately $525 per square foot. 6600 Warner Ave Unit 114 is a home located in Orange County with nearby schools including Golden View Elementary School - Environmental Science School, Mesa View Middle School, and Ocean View High.
Ownership History
Date
Name
Owned For
Owner Type
Purchase Details
Closed on
Dec 30, 2024
Sold by
Debacker Thomas E and Debacker Rachel C
Bought by
Debacker Family Trust and Debacker
Current Estimated Value
Purchase Details
Closed on
Apr 23, 2024
Sold by
Grove Trust and Grove Lionel D
Bought by
Debacker Thomas Eugene and Debacker Rachel
Home Financials for this Owner
Home Financials are based on the most recent Mortgage that was taken out on this home.
Original Mortgage
$320,000
Interest Rate
6.88%
Mortgage Type
New Conventional
Purchase Details
Closed on
Sep 23, 2009
Sold by
Grove Lionel D and Grove Marsha L
Bought by
Grove Lionel D and Grove Marsha L
Purchase Details
Closed on
Nov 18, 2002
Sold by
Mitchell Farrel B and Mitchell Connie L
Bought by
Grove Lionel and Grove Marsha
Home Financials for this Owner
Home Financials are based on the most recent Mortgage that was taken out on this home.
Original Mortgage
$150,000
Interest Rate
6.06%
Create a Home Valuation Report for This Property
The Home Valuation Report is an in-depth analysis detailing your home's value as well as a comparison with similar homes in the area
Home Values in the Area
Average Home Value in this Area
Purchase History
| Date | Buyer | Sale Price | Title Company |
|---|---|---|---|
| Debacker Family Trust | -- | None Listed On Document | |
| Debacker Thomas Eugene | $560,000 | Ticor Title | |
| Grove Lionel D | -- | None Available | |
| Grove Lionel | $216,000 | Chicago Title Co |
Source: Public Records
Mortgage History
| Date | Status | Borrower | Loan Amount |
|---|---|---|---|
| Previous Owner | Debacker Thomas Eugene | $320,000 | |
| Previous Owner | Grove Lionel | $150,000 |
Source: Public Records
Tax History Compared to Growth
Tax History
| Year | Tax Paid | Tax Assessment Tax Assessment Total Assessment is a certain percentage of the fair market value that is determined by local assessors to be the total taxable value of land and additions on the property. | Land | Improvement |
|---|---|---|---|---|
| 2025 | $3,746 | $571,200 | $487,154 | $84,046 |
| 2024 | $3,746 | $306,693 | $224,915 | $81,778 |
| 2023 | $3,659 | $300,680 | $220,505 | $80,175 |
| 2022 | $3,603 | $294,785 | $216,182 | $78,603 |
| 2021 | $3,538 | $289,005 | $211,943 | $77,062 |
| 2020 | $3,499 | $286,042 | $209,770 | $76,272 |
| 2019 | $3,441 | $280,434 | $205,657 | $74,777 |
| 2018 | $3,366 | $274,936 | $201,625 | $73,311 |
| 2017 | $3,314 | $269,546 | $197,672 | $71,874 |
| 2016 | $3,183 | $264,261 | $193,796 | $70,465 |
| 2015 | $3,135 | $260,292 | $190,885 | $69,407 |
| 2014 | $3,073 | $255,194 | $187,146 | $68,048 |
Source: Public Records
Map
Nearby Homes
- 6600 Warner Ave Unit 50
- 6600 Warner Ave Unit 102
- 6600 Warner Ave
- 6672 Sun Dr Unit B
- 16892 Limelight Cir Unit B
- 6301 Warner Ave Unit 88
- 6301 Warner Ave Unit 40
- 17231 Lido Ln
- 6611 Crista Palma Dr
- 17071 Pinehurst Ln
- 17442 Coronado Ln
- 6051 Summerdale Dr
- 6351 Gloria Dr
- 16722 Goldenwest St
- 6292 Heil Ave
- 6171 Gumm Dr
- 16401 Mercier Ln
- 7252 Elk Cir
- 17261 Gothard St Unit 60
- 17261 Gothard St Unit 50
- 6600 Warner Ave Unit 191
- 6600 Warner Ave Unit 63
- 6600 Warner Ave Unit 248
- 6600 Warner Ave Unit 56
- 6600 Warner Ave Unit Modern Condo
- 6600 Warner Ave Unit 65
- 6600 Warner Ave Unit 256
- 6600 Warner Ave Unit 147
- 6600 Warner Ave Unit 69
- 6600 Warner Ave Unit 73
- 6600 Warner Ave Unit 92
- 6600 Warner Ave Unit 118
- 6600 Warner Ave Unit 130
- 6600 Warner Ave Unit 84
- 6600 Warner Ave Unit 115
- 6600 Warner Ave Unit 156
- 6600 Warner Ave Unit 246
- 6600 Warner Ave Unit 241
- 6600 Warner Ave Unit 141
- 6600 Warner Ave Unit 88