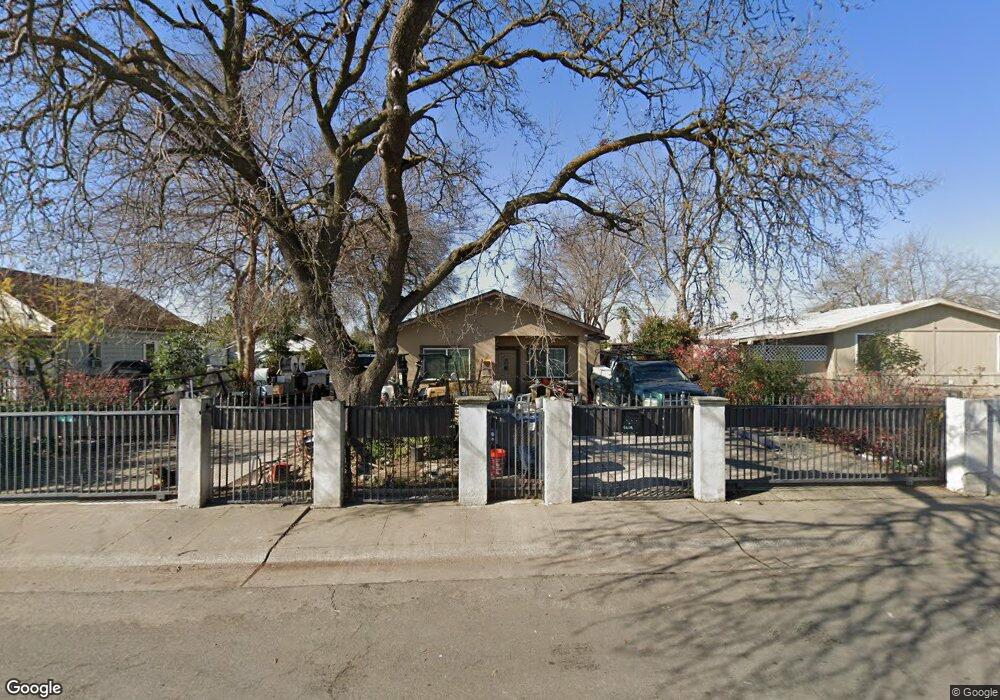
6608 30th St Sacramento, CA 95822
Woodbine NeighborhoodEstimated Value: $376,872 - $423,000
2
Beds
1
Bath
760
Sq Ft
$527/Sq Ft
Est. Value
About This Home
This home is located at 6608 30th St, Sacramento, CA 95822 and is currently estimated at $400,468, approximately $526 per square foot. 6608 30th St is a home located in Sacramento County with nearby schools including Woodbine Elementary School, Rosa Parks Elementary School, and Luther Burbank High School.
Ownership History
Date
Name
Owned For
Owner Type
Purchase Details
Closed on
Jun 12, 2009
Sold by
Hsbc Bank Usa National Association
Bought by
Vasquez Pedro Lopez
Current Estimated Value
Purchase Details
Closed on
Apr 1, 2009
Sold by
Cisneros Francisco
Bought by
Hsbc Bank Usa National Association
Purchase Details
Closed on
Aug 24, 2006
Sold by
Cisneros Patricia
Bought by
Cisneros Francisco
Home Financials for this Owner
Home Financials are based on the most recent Mortgage that was taken out on this home.
Original Mortgage
$212,000
Interest Rate
8.3%
Mortgage Type
Balloon
Purchase Details
Closed on
Aug 23, 2006
Sold by
Hernandez Martin M
Bought by
Cisneros Francisco
Home Financials for this Owner
Home Financials are based on the most recent Mortgage that was taken out on this home.
Original Mortgage
$212,000
Interest Rate
8.3%
Mortgage Type
Balloon
Create a Home Valuation Report for This Property
The Home Valuation Report is an in-depth analysis detailing your home's value as well as a comparison with similar homes in the area
Home Values in the Area
Average Home Value in this Area
Purchase History
| Date | Buyer | Sale Price | Title Company |
|---|---|---|---|
| Vasquez Pedro Lopez | $60,000 | Chicago Title Company | |
| Hsbc Bank Usa National Association | $62,900 | None Available | |
| Cisneros Francisco | -- | Placer Title Company | |
| Cisneros Francisco | $265,000 | Placer Title Company | |
| Hernandez Martin M | -- | Placer Title Company |
Source: Public Records
Mortgage History
| Date | Status | Borrower | Loan Amount |
|---|---|---|---|
| Previous Owner | Hernandez Martin M | $212,000 |
Source: Public Records
Tax History Compared to Growth
Tax History
| Year | Tax Paid | Tax Assessment Tax Assessment Total Assessment is a certain percentage of the fair market value that is determined by local assessors to be the total taxable value of land and additions on the property. | Land | Improvement |
|---|---|---|---|---|
| 2025 | $2,171 | $167,960 | $32,183 | $135,777 |
| 2024 | $2,171 | $164,667 | $31,552 | $133,115 |
| 2023 | $2,113 | $161,439 | $30,934 | $130,505 |
| 2022 | $2,091 | $158,275 | $30,328 | $127,947 |
| 2021 | $1,989 | $155,173 | $29,734 | $125,439 |
| 2020 | $1,998 | $153,583 | $29,430 | $124,153 |
| 2019 | $1,957 | $150,572 | $28,853 | $121,719 |
| 2018 | $1,906 | $147,621 | $28,288 | $119,333 |
| 2017 | $1,875 | $144,728 | $27,734 | $116,994 |
| 2016 | $1,835 | $141,891 | $27,191 | $114,700 |
| 2015 | $1,778 | $139,761 | $26,783 | $112,978 |
| 2014 | $1,604 | $125,024 | $26,259 | $98,765 |
Source: Public Records
Map
Nearby Homes
- 2536 47th Ave
- 2429 50th Ave
- 2629 47th Ave
- 2475 Wah Ave
- 2481 Wah Ave
- 2463 Wah Ave
- 2469 Wah Ave
- 2835 Hing Ave
- 6815 24th St
- 2343 Thompson Way
- 2324 Mangrum Ave
- 6887 N Tranquility Dr
- 3635 51st Ave
- 3711 46th Ave
- 3715 46th Ave
- 6915 Sundown Dr
- 2529 Encinal Ave
- 2440 40th Ave
- 7066 Tranquility Dr
- 3835 Stillman Park Cir