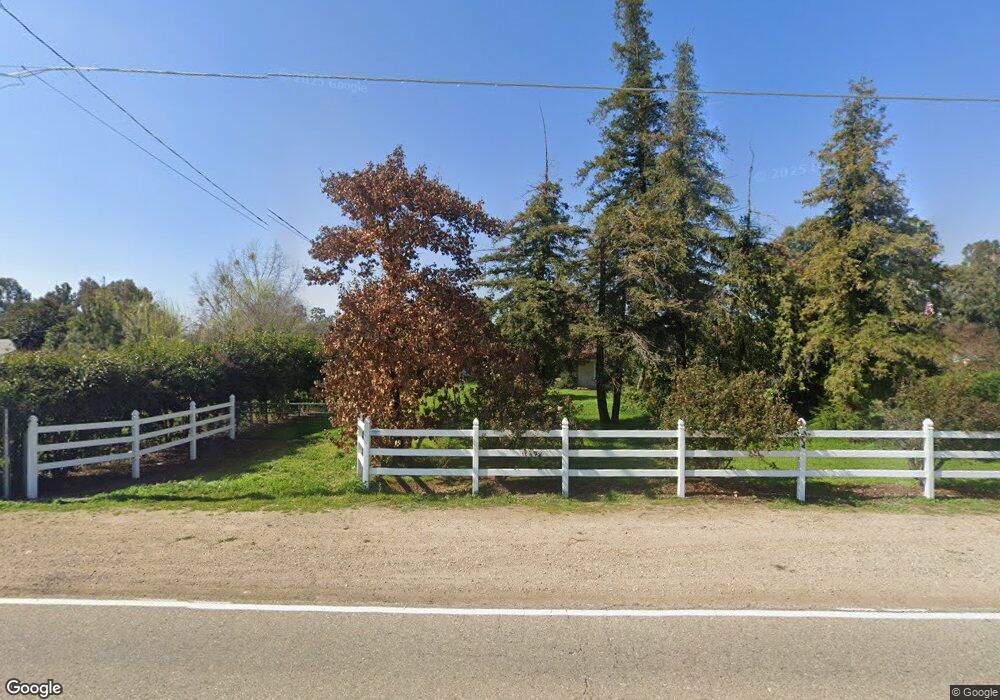
6609 N Mccall Ave Clovis, CA 93619
Estimated Value: $462,000 - $605,908
3
Beds
2
Baths
1,582
Sq Ft
$334/Sq Ft
Est. Value
About This Home
This home is located at 6609 N Mccall Ave, Clovis, CA 93619 and is currently estimated at $528,969, approximately $334 per square foot. 6609 N Mccall Ave is a home located in Fresno County with nearby schools including Cedarwood Elementary School, Clark Intermediate School, and Clovis High School.
Ownership History
Date
Name
Owned For
Owner Type
Purchase Details
Closed on
Sep 17, 2018
Sold by
Weibert Gregory and Weibert Jayne
Bought by
Weibert Gregory E and Weibert Jayne E
Current Estimated Value
Purchase Details
Closed on
Sep 6, 2011
Sold by
Dugan James and Dugan Valerie
Bought by
Weibert Gregory and Weibert Jayne
Purchase Details
Closed on
Dec 1, 2003
Sold by
Massie Joshua and Massie Juliana
Bought by
Dugan James and Dugan Valerie
Home Financials for this Owner
Home Financials are based on the most recent Mortgage that was taken out on this home.
Original Mortgage
$219,000
Interest Rate
5%
Mortgage Type
Unknown
Purchase Details
Closed on
May 16, 2001
Sold by
Shonkwiler Martha H
Bought by
Massie Joshua and Massie Juliana
Home Financials for this Owner
Home Financials are based on the most recent Mortgage that was taken out on this home.
Original Mortgage
$159,600
Interest Rate
7.15%
Purchase Details
Closed on
Aug 5, 1997
Sold by
Devlin Martha H and Devlin Martha H
Bought by
Shonkwiler Martha H
Create a Home Valuation Report for This Property
The Home Valuation Report is an in-depth analysis detailing your home's value as well as a comparison with similar homes in the area
Purchase History
| Date | Buyer | Sale Price | Title Company |
|---|---|---|---|
| Weibert Gregory E | -- | None Available | |
| Weibert Gregory | $175,000 | Fidelity National Title Co | |
| Dugan James | $279,000 | First American Title Ins Co | |
| Massie Joshua | $168,000 | Financial Title Company | |
| Shonkwiler Martha H | -- | -- |
Source: Public Records
Mortgage History
| Date | Status | Borrower | Loan Amount |
|---|---|---|---|
| Previous Owner | Dugan James | $219,000 | |
| Previous Owner | Massie Joshua | $159,600 |
Source: Public Records
Tax History
| Year | Tax Paid | Tax Assessment Tax Assessment Total Assessment is a certain percentage of the fair market value that is determined by local assessors to be the total taxable value of land and additions on the property. | Land | Improvement |
|---|---|---|---|---|
| 2025 | $2,595 | $219,797 | $125,599 | $94,198 |
| 2023 | $2,496 | $211,264 | $120,723 | $90,541 |
| 2022 | $2,463 | $207,122 | $118,356 | $88,766 |
| 2021 | $2,394 | $203,062 | $116,036 | $87,026 |
| 2020 | $2,385 | $200,981 | $114,847 | $86,134 |
| 2019 | $2,339 | $197,042 | $112,596 | $84,446 |
| 2018 | $2,288 | $193,180 | $110,389 | $82,791 |
| 2017 | $2,249 | $189,393 | $108,225 | $81,168 |
| 2016 | $2,172 | $185,680 | $106,103 | $79,577 |
| 2015 | $2,139 | $182,892 | $104,510 | $78,382 |
| 2014 | $2,100 | $179,310 | $102,463 | $76,847 |
Source: Public Records
Map
Nearby Homes
- 10464 E Herndon Ave
- 9321 E Bullard Ave
- 11236 E Herndon Ave
- 10595 E San Felipe Ave
- 637 Soledad Ave
- 7881 N Thompson Ave
- 1040 San Marino Ave
- 1006 La Canada Ave
- 1437 Las Rosas Ave
- 1100 Corazon Ave
- 11640 E Sierra Ave
- 3833 Hannah Ln
- 4148 Beverly Ave
- 0 E Herndon Ave Unit WS25111634
- 3919 Portals Ave
- 4080 San Jose Ave
- 10455 E Greenbury Way
- 1043 La Jolla Ave
- 4103 Keats Ave
- 1667 Las Rosas Ave
- 6639 N Mccall Ave
- 6575 N Mccall Ave
- 6671 N Mccall Ave
- 6697 N Mccall Ave
- 6505 N Mccall Ave
- 9880 E Sierra Ave
- 6502 N Mccall Ave
- 6739 N Mccall Ave
- 9850 E Sierra Ave
- 6850 N Mccall Ave
- 6773 N Mccall Ave
- 9838 E Sierra Ave
- 6464 N Sheridan Rd
- 9766 E Sierra Ave
- 9810 E Sierra Ave
- 6728 N Mccall Ave
- 6805 N Mccall Ave
- 9722 E Sierra Ave
- 6436 N Sheridan Rd
- 9718 E Sierra Ave
Your Personal Tour Guide
Ask me questions while you tour the home.