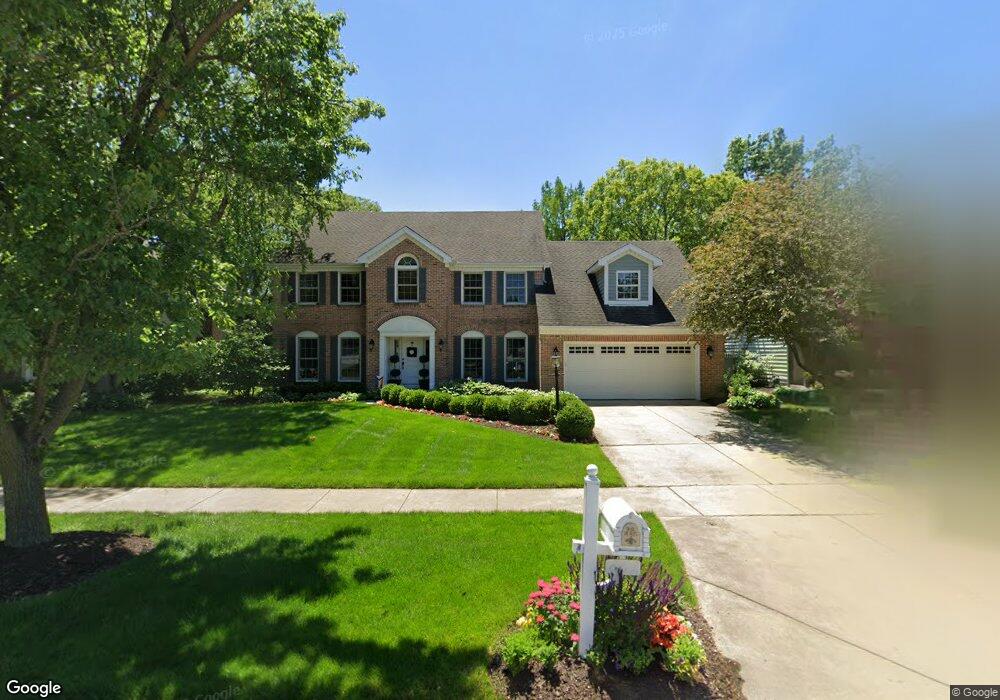
661 Alexandria Dr Unit 1 Naperville, IL 60565
River Woods NeighborhoodEstimated Value: $850,000 - $923,000
5
Beds
4
Baths
3,350
Sq Ft
$265/Sq Ft
Est. Value
About This Home
This home is located at 661 Alexandria Dr Unit 1, Naperville, IL 60565 and is currently estimated at $887,359, approximately $264 per square foot. 661 Alexandria Dr Unit 1 is a home located in Will County with nearby schools including River Woods Elementary School, Madison Jr High School, and Naperville Central High School.
Ownership History
Date
Name
Owned For
Owner Type
Purchase Details
Closed on
Feb 10, 2019
Sold by
Lucke David and Lucke Ellen
Bought by
Lucke David and Lucke Ellen
Current Estimated Value
Purchase Details
Closed on
Jan 11, 2011
Sold by
Law Michael Grant and Law Debra J
Bought by
Lucke David and Lucke Ellen K
Home Financials for this Owner
Home Financials are based on the most recent Mortgage that was taken out on this home.
Original Mortgage
$400,000
Outstanding Balance
$271,007
Interest Rate
4.65%
Mortgage Type
New Conventional
Estimated Equity
$616,352
Purchase Details
Closed on
Feb 23, 2010
Sold by
Law Debra J
Bought by
Law Michael Grant and Law Debra J
Home Financials for this Owner
Home Financials are based on the most recent Mortgage that was taken out on this home.
Original Mortgage
$417,000
Interest Rate
4.96%
Mortgage Type
New Conventional
Create a Home Valuation Report for This Property
The Home Valuation Report is an in-depth analysis detailing your home's value as well as a comparison with similar homes in the area
Home Values in the Area
Average Home Value in this Area
Purchase History
| Date | Buyer | Sale Price | Title Company |
|---|---|---|---|
| Lucke David | -- | Attorney | |
| Lucke David | $578,000 | Baird & Warner Title Service | |
| Law Michael Grant | -- | Prism Title |
Source: Public Records
Mortgage History
| Date | Status | Borrower | Loan Amount |
|---|---|---|---|
| Open | Lucke David | $400,000 | |
| Previous Owner | Law Michael Grant | $417,000 |
Source: Public Records
Tax History Compared to Growth
Tax History
| Year | Tax Paid | Tax Assessment Tax Assessment Total Assessment is a certain percentage of the fair market value that is determined by local assessors to be the total taxable value of land and additions on the property. | Land | Improvement |
|---|---|---|---|---|
| 2024 | $16,115 | $257,768 | $61,150 | $196,618 |
| 2023 | $16,115 | $231,931 | $55,021 | $176,910 |
| 2022 | $14,114 | $211,194 | $49,604 | $161,590 |
| 2021 | $13,179 | $197,470 | $46,381 | $151,089 |
| 2020 | $12,684 | $190,977 | $44,856 | $146,121 |
| 2019 | $12,254 | $181,883 | $42,720 | $139,163 |
| 2018 | $11,698 | $174,084 | $40,888 | $133,196 |
| 2017 | $12,566 | $183,342 | $43,062 | $140,280 |
| 2016 | $12,665 | $181,800 | $42,700 | $139,100 |
| 2015 | $11,804 | $174,400 | $41,000 | $133,400 |
| 2014 | $11,804 | $169,300 | $39,800 | $129,500 |
| 2013 | $11,804 | $166,000 | $39,000 | $127,000 |
Source: Public Records
Map
Nearby Homes
- 627 Nanak Ct
- 710 Alexandria Dr
- 743 Arlington Ave
- 342 Dilorenzo Dr
- 2697 Fox River Ln
- 2280 Barth Dr
- 705 Potomac Ave
- 2421 River Woods Dr
- 1120 Colgate Ct
- 44 Oak Bluff Ct
- 15 Pinnacle Ct
- 805 Potomac Ave
- 2279 Kaskaskia Ct
- 36 Oak Bluff Ct
- 20 Pinnacle Ct
- 2230 Keim Rd Unit 3B
- 336 Brooklea Ct
- 816 Spindletree Ave
- 51 Ford Ln
- 2474 Wendover Dr
- 665 Alexandria Dr
- 657 Alexandria Dr
- 653 Alexandria Dr
- 669 Alexandria Dr
- 2489 Rio Grande Cir
- 2480 Rio Grande Cir Unit 1
- 674 Alexandria Dr
- 673 Alexandria Dr
- 2476 Rio Grande Cir
- 2402 Cimarron Ct Unit 1
- 623 Nanak Ct
- 2500 River Woods Dr
- 678 Alexandria Dr
- 619 Nanak Ct
- 677 Alexandria Dr
- 2485 Rio Grande Cir
- 631 Nanak Ct
- 2406 Cimarron Ct
- 2472 Rio Grande Cir
- 2481 Rio Grande Cir