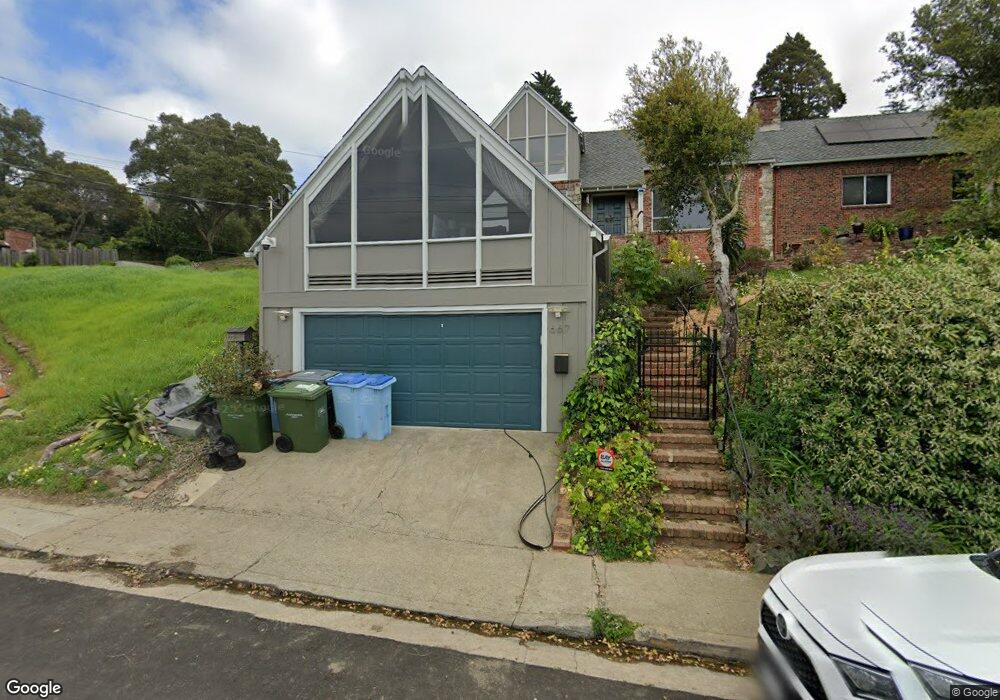
661 Euclid Ave Berkeley, CA 94708
Berkeley Hills NeighborhoodEstimated Value: $846,000 - $1,275,000
1
Bed
1
Bath
604
Sq Ft
$1,793/Sq Ft
Est. Value
About This Home
This home is located at 661 Euclid Ave, Berkeley, CA 94708 and is currently estimated at $1,082,898, approximately $1,792 per square foot. 661 Euclid Ave is a home located in Alameda County with nearby schools including Cragmont Elementary School, Berkeley Arts Magnet at Whittier School, and Washington Elementary School.
Ownership History
Date
Name
Owned For
Owner Type
Purchase Details
Closed on
Dec 19, 2018
Sold by
Boddum Jerry J and Boddum Ann R
Bought by
Ge Yan
Current Estimated Value
Home Financials for this Owner
Home Financials are based on the most recent Mortgage that was taken out on this home.
Original Mortgage
$800,000
Outstanding Balance
$706,224
Interest Rate
4.9%
Mortgage Type
Seller Take Back
Estimated Equity
$376,674
Purchase Details
Closed on
Dec 13, 2018
Sold by
Wang Fei
Bought by
Ge Yan
Home Financials for this Owner
Home Financials are based on the most recent Mortgage that was taken out on this home.
Original Mortgage
$800,000
Outstanding Balance
$706,224
Interest Rate
4.9%
Mortgage Type
Seller Take Back
Estimated Equity
$376,674
Purchase Details
Closed on
Oct 16, 2003
Sold by
Neureuther Cynthia Jean and Collins Virginia Jean
Bought by
Boddum Jerry J and Boddum Mary Ann R
Create a Home Valuation Report for This Property
The Home Valuation Report is an in-depth analysis detailing your home's value as well as a comparison with similar homes in the area
Home Values in the Area
Average Home Value in this Area
Purchase History
| Date | Buyer | Sale Price | Title Company |
|---|---|---|---|
| Ge Yan | $1,800,000 | Old Republic Title Company | |
| Ge Yan | -- | Old Republic Title Company | |
| Boddum Jerry J | $900,000 | Placer Title Company |
Source: Public Records
Mortgage History
| Date | Status | Borrower | Loan Amount |
|---|---|---|---|
| Open | Ge Yan | $800,000 |
Source: Public Records
Tax History
| Year | Tax Paid | Tax Assessment Tax Assessment Total Assessment is a certain percentage of the fair market value that is determined by local assessors to be the total taxable value of land and additions on the property. | Land | Improvement |
|---|---|---|---|---|
| 2025 | $12,163 | $853,357 | $446,200 | $407,157 |
| 2024 | $12,163 | $836,626 | $437,452 | $399,174 |
| 2023 | $11,918 | $820,225 | $428,876 | $391,349 |
| 2022 | $11,728 | $804,145 | $420,468 | $383,677 |
| 2021 | $11,769 | $788,378 | $412,224 | $376,154 |
| 2020 | $11,219 | $780,300 | $408,000 | $372,300 |
| 2019 | $10,864 | $765,000 | $400,000 | $365,000 |
| 2018 | $10,693 | $749,711 | $224,913 | $524,798 |
| 2017 | $10,307 | $735,011 | $220,503 | $514,508 |
| 2016 | $10,032 | $720,600 | $216,180 | $504,420 |
| 2015 | $9,919 | $709,775 | $212,932 | $496,843 |
| 2014 | $9,251 | $650,000 | $195,000 | $455,000 |
Source: Public Records
Map
Nearby Homes
- 614 Cragmont Ave
- 606 Grizzly Peak Blvd
- 777 Cragmont Ave
- 758 Spruce St
- 543 Grizzly Peak Blvd
- 470 Spruce St
- 765 San Diego Rd
- 813 San Diego Rd
- 410 Grizzly Peak Blvd
- 483 Boynton Ave
- 589 San Luis Rd
- 935 Grizzly Peak Blvd
- 450 Vermont Ave
- 730 Wildcat Canyon Rd
- 962 Regal Rd
- 1983 Yosemite Rd
- 938 San Benito Rd
- 380 Vermont Ave
- 1004 Cragmont Ave
- 1024 Grizzly Peak Blvd
- 661 Euclid Ave
- 661 Euclid Ave
- 661 Euclid Ave
- 661 Euclid Ave
- 661 Euclid Ave
- 661 Euclid Ave
- 661 Euclid Ave
- 661ABC Euclid Ave Parcel Abc
- 667 Euclid Ave
- 680 Hilldale Ave
- 670 Hilldale Ave
- 684 Hilldale Ave
- 660 Hilldale Ave
- 645 Euclid Ave
- 650 Hilldale Ave
- 690 Hilldale Ave
- 669 Euclid Ave
- 640 Hilldale Ave
- 692 Hilldale Ave
- 694 Hilldale Ave
Your Personal Tour Guide
Ask me questions while you tour the home.