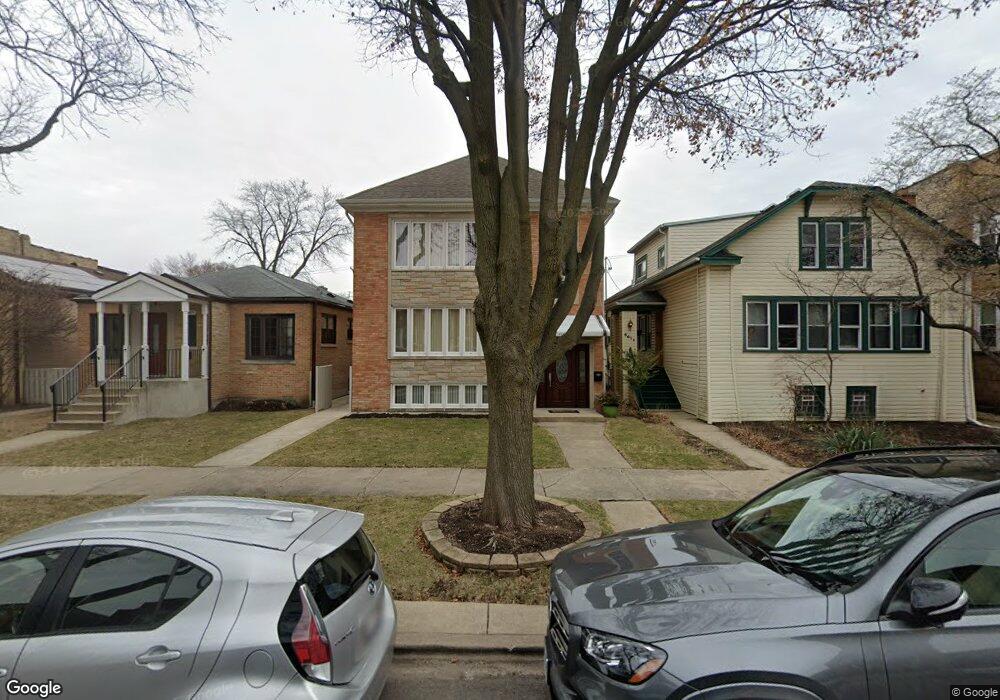
6613 N Maplewood Ave Chicago, IL 60645
West Ridge NeighborhoodEstimated Value: $625,000 - $708,119
8
Beds
6
Baths
3,124
Sq Ft
$216/Sq Ft
Est. Value
About This Home
This home is located at 6613 N Maplewood Ave, Chicago, IL 60645 and is currently estimated at $675,040, approximately $216 per square foot. 6613 N Maplewood Ave is a home located in Cook County with nearby schools including Mosaic School of Fine Arts, Mather High School, and Bethesda International Academy.
Ownership History
Date
Name
Owned For
Owner Type
Purchase Details
Closed on
Dec 4, 2018
Sold by
Crisan Florica and Crisan Daniel
Bought by
Crisan Florica
Current Estimated Value
Purchase Details
Closed on
Jun 2, 1999
Sold by
Cole Hugh L and Cole Ailing H
Bought by
Crisan Daniel and Crisan Florica
Home Financials for this Owner
Home Financials are based on the most recent Mortgage that was taken out on this home.
Original Mortgage
$225,000
Outstanding Balance
$59,047
Interest Rate
6.99%
Mortgage Type
Commercial
Estimated Equity
$615,993
Purchase Details
Closed on
Nov 5, 1993
Sold by
Beniamine William D and Beniamine Beronia M
Bought by
Cole Hugh L and Cole Ailing H
Home Financials for this Owner
Home Financials are based on the most recent Mortgage that was taken out on this home.
Original Mortgage
$214,000
Interest Rate
6.95%
Mortgage Type
Commercial
Create a Home Valuation Report for This Property
The Home Valuation Report is an in-depth analysis detailing your home's value as well as a comparison with similar homes in the area
Home Values in the Area
Average Home Value in this Area
Purchase History
| Date | Buyer | Sale Price | Title Company |
|---|---|---|---|
| Crisan Florica | -- | Attorney | |
| Crisan Daniel | $305,000 | -- | |
| Cole Hugh L | $158,666 | -- |
Source: Public Records
Mortgage History
| Date | Status | Borrower | Loan Amount |
|---|---|---|---|
| Open | Crisan Daniel | $225,000 | |
| Previous Owner | Cole Hugh L | $214,000 |
Source: Public Records
Tax History Compared to Growth
Tax History
| Year | Tax Paid | Tax Assessment Tax Assessment Total Assessment is a certain percentage of the fair market value that is determined by local assessors to be the total taxable value of land and additions on the property. | Land | Improvement |
|---|---|---|---|---|
| 2024 | $8,795 | $58,001 | $10,313 | $47,688 |
| 2023 | $8,552 | $45,000 | $8,250 | $36,750 |
| 2022 | $8,552 | $45,000 | $8,250 | $36,750 |
| 2021 | $8,379 | $45,000 | $8,250 | $36,750 |
| 2020 | $6,186 | $30,873 | $7,012 | $23,861 |
| 2019 | $6,465 | $35,609 | $7,012 | $28,597 |
| 2018 | $6,355 | $35,609 | $7,012 | $28,597 |
| 2017 | $6,486 | $33,506 | $6,187 | $27,319 |
| 2016 | $6,211 | $33,506 | $6,187 | $27,319 |
| 2015 | $5,659 | $33,506 | $6,187 | $27,319 |
| 2014 | $4,817 | $28,533 | $5,775 | $22,758 |
| 2013 | $4,711 | $28,533 | $5,775 | $22,758 |
Source: Public Records
Map
Nearby Homes
- 6609 N Artesian Ave
- 6712 N Maplewood Ave
- 6727 N Maplewood Ave
- 6558 N Washtenaw Ave Unit 2
- 6452 N Claremont Ave Unit 3
- 6418 N Rockwell St
- 6414 N Rockwell St
- 6700 N Fairfield Ave
- 2322 W Farwell Ave Unit 1W
- 6455 N Bell Ave Unit 2
- 6319 N Artesian Ave Unit 3W
- 6345 N Washtenaw Ave Unit GW
- 6827 N Oakley Ave Unit 3C
- 2759 W Arthur Ave Unit 3
- 6457 N California Ave Unit 3
- 2614 W Morse Ave
- 2243 W Farwell Ave Unit 3D
- 6833 N Oakley Ave Unit 3A
- 6451 N California Ave Unit 2
- 2300 W Farwell Ave Unit 2
- 6611 N Maplewood Ave
- 6607 N Maplewood Ave Unit 1
- 6621 N Maplewood Ave
- 6625 N Maplewood Ave
- 6605 N Maplewood Ave
- 6603 N Maplewood Ave
- 6629 N Maplewood Ave
- 6610 N Maplewood Ave
- 6631 N Maplewood Ave
- 6614 N Campbell Ave Unit 1
- 6614 N Maplewood Ave
- 6610 N Campbell Ave
- 6618 N Campbell Ave Unit 2
- 6618 N Campbell Ave
- 6608 N Campbell Ave Unit 2
- 6608 N Campbell Ave
- 6608 N Maplewood Ave
- 6624 N Campbell Ave
- 6618 N Maplewood Ave
- 6620 N Campbell Ave Unit 1