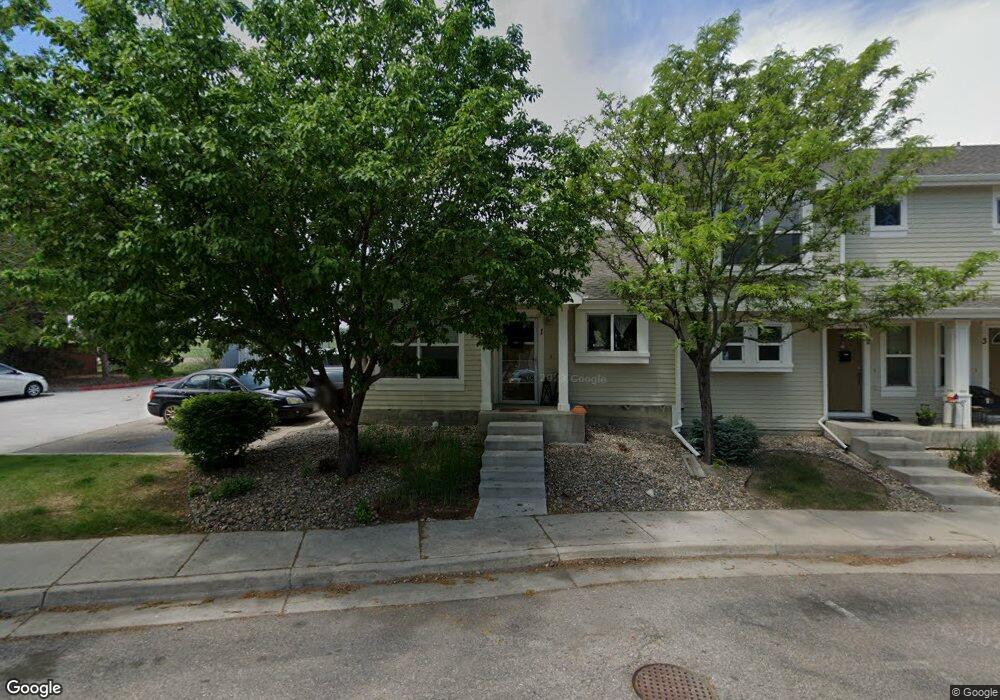
6615 Desert Willow Way Unit F3 Fort Collins, CO 80525
Provincetowne NeighborhoodEstimated Value: $297,928 - $352,000
3
Beds
2
Baths
1,152
Sq Ft
$271/Sq Ft
Est. Value
About This Home
This home is located at 6615 Desert Willow Way Unit F3, Fort Collins, CO 80525 and is currently estimated at $312,232, approximately $271 per square foot. 6615 Desert Willow Way Unit F3 is a home located in Larimer County with nearby schools including Cottonwood Plains Elementary School, Lucile Erwin Middle School, and Loveland High School.
Ownership History
Date
Name
Owned For
Owner Type
Purchase Details
Closed on
Apr 28, 2017
Sold by
Duncan Paul M and Duncan Christine L
Bought by
Johnson Scott D and Johnson Shelley A
Current Estimated Value
Purchase Details
Closed on
Jun 17, 2008
Sold by
Hud
Bought by
Kagey Amy
Purchase Details
Closed on
Jan 22, 2008
Sold by
Mcgimpsey Susanna J
Bought by
Secretary Of Housing & Urban Development
Purchase Details
Closed on
Aug 28, 2002
Sold by
Kb Home Colorado Inc
Bought by
Mcgimpsey Susanna J
Home Financials for this Owner
Home Financials are based on the most recent Mortgage that was taken out on this home.
Original Mortgage
$125,700
Interest Rate
6.47%
Mortgage Type
FHA
Create a Home Valuation Report for This Property
The Home Valuation Report is an in-depth analysis detailing your home's value as well as a comparison with similar homes in the area
Home Values in the Area
Average Home Value in this Area
Purchase History
| Date | Buyer | Sale Price | Title Company |
|---|---|---|---|
| Johnson Scott D | $215,500 | None Available | |
| Kagey Amy | $100,500 | None Available | |
| Secretary Of Housing & Urban Development | $138,120 | None Available | |
| Mcgimpsey Susanna J | $132,335 | -- |
Source: Public Records
Mortgage History
| Date | Status | Borrower | Loan Amount |
|---|---|---|---|
| Previous Owner | Mcgimpsey Susanna J | $125,700 |
Source: Public Records
Tax History Compared to Growth
Tax History
| Year | Tax Paid | Tax Assessment Tax Assessment Total Assessment is a certain percentage of the fair market value that is determined by local assessors to be the total taxable value of land and additions on the property. | Land | Improvement |
|---|---|---|---|---|
| 2025 | $1,412 | $20,247 | $2,338 | $17,909 |
| 2024 | $1,365 | $20,247 | $2,338 | $17,909 |
| 2022 | $1,322 | $15,527 | $2,426 | $13,101 |
| 2021 | $1,360 | $15,973 | $2,495 | $13,478 |
| 2020 | $1,353 | $15,894 | $2,495 | $13,399 |
| 2019 | $1,332 | $15,894 | $2,495 | $13,399 |
| 2018 | $1,095 | $12,449 | $2,513 | $9,936 |
| 2017 | $953 | $12,449 | $2,513 | $9,936 |
| 2016 | $823 | $10,420 | $2,778 | $7,642 |
| 2015 | $817 | $10,420 | $2,780 | $7,640 |
| 2014 | $772 | $9,550 | $2,780 | $6,770 |
Source: Public Records
Map
Nearby Homes
- 6603 Autumn Ridge Dr Unit 2
- 708 Crown Ridge Ln Unit 3
- 708 Crown Ridge Ln
- 6827 Autumn Ridge Dr Unit 1
- 6908 Autumn Ridge Dr
- 6721 Antigua Dr Unit 57
- 6803 Antigua Dr
- 0 Antigua Dr
- 6702 Antigua Dr Unit 49
- 505 Coyote Trail Dr
- 216 Gary Dr
- 7151 Shadow Ridge Dr
- 715 Yarnell Ct
- 5926 Huntington Hills Dr
- 1314 Saint Croix Place
- 5942 Colby St
- 5925 Auburn Dr
- 6815 S College Ave
- 1306 Paragon Place
- 217 W Trilby Rd
- 6615 Desert Willow Way Unit C1
- 6615 Desert Willow Way Unit C2
- 6615 Desert Willow Way Unit C3
- 6615 Desert Willow Way Unit C4
- 6615 Desert Willow Way Unit D1
- 6615 Desert Willow Way Unit D2
- 6615 Desert Willow Way Unit D3
- 6615 Desert Willow Way Unit E1
- 6615 Desert Willow Way Unit E2
- 6615 Desert Willow Way Unit E3
- 6615 Desert Willow Way Unit F1
- 6615 Desert Willow Way Unit F2
- 6615 Desert Willow Way Unit F4
- 6615 Desert Willow Way Unit F5
- 6615 Desert Willow Way Unit F6
- 6615 Desert Willow Way Unit G4
- 6615 Desert Willow Way Unit G3
- 6615 Desert Willow Way Unit G2
- 6615 Desert Willow Way Unit G1
- 6615 Desert Willow Way Unit B4