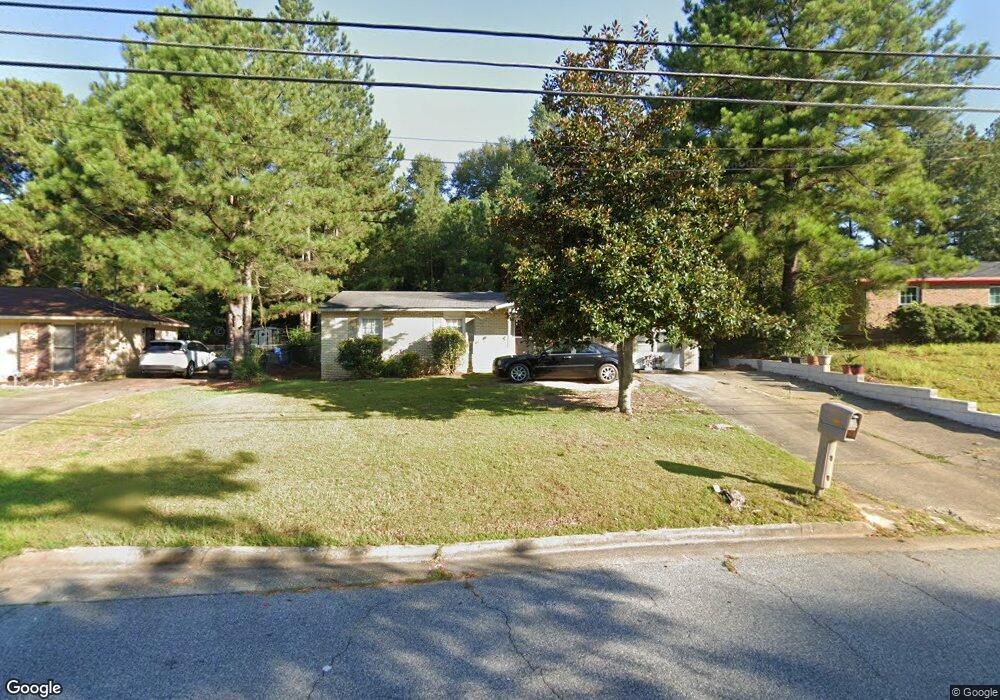
6615 Dorsey Dr Columbus, GA 31907
Eastern Columbus NeighborhoodEstimated Value: $111,000 - $149,000
3
Beds
2
Baths
1,350
Sq Ft
$99/Sq Ft
Est. Value
About This Home
This home is located at 6615 Dorsey Dr, Columbus, GA 31907 and is currently estimated at $133,688, approximately $99 per square foot. 6615 Dorsey Dr is a home located in Muscogee County with nearby schools including Georgetown Elementary School, East Columbus Magnet Academy, and Kendrick High School.
Ownership History
Date
Name
Owned For
Owner Type
Purchase Details
Closed on
May 13, 2015
Sold by
Saver Delena
Bought by
Garcia Ola
Current Estimated Value
Home Financials for this Owner
Home Financials are based on the most recent Mortgage that was taken out on this home.
Original Mortgage
$54,884
Outstanding Balance
$42,449
Interest Rate
3.79%
Mortgage Type
New Conventional
Estimated Equity
$91,239
Purchase Details
Closed on
Dec 27, 2012
Sold by
Dowdy Bob H
Bought by
Savee Maurice Delena
Purchase Details
Closed on
Aug 27, 2010
Sold by
Us Bank National Association
Bought by
Dowdy Bobby Hugh
Purchase Details
Closed on
Dec 1, 2009
Sold by
Davis Tommie R
Bought by
Us Bank National Association
Purchase Details
Closed on
Jun 21, 2005
Sold by
Washington Tammy
Bought by
Phenix Girard Bank
Create a Home Valuation Report for This Property
The Home Valuation Report is an in-depth analysis detailing your home's value as well as a comparison with similar homes in the area
Home Values in the Area
Average Home Value in this Area
Purchase History
| Date | Buyer | Sale Price | Title Company |
|---|---|---|---|
| Garcia Ola | $57,384 | -- | |
| Savee Maurice Delena | -- | -- | |
| Dowdy Bobby Hugh | $45,000 | Specialized Title Svcs Llc | |
| Us Bank National Association | $54,789 | None Available | |
| Phenix Girard Bank | -- | None Available |
Source: Public Records
Mortgage History
| Date | Status | Borrower | Loan Amount |
|---|---|---|---|
| Open | Garcia Ola | $54,884 |
Source: Public Records
Tax History Compared to Growth
Tax History
| Year | Tax Paid | Tax Assessment Tax Assessment Total Assessment is a certain percentage of the fair market value that is determined by local assessors to be the total taxable value of land and additions on the property. | Land | Improvement |
|---|---|---|---|---|
| 2025 | $208 | $41,840 | $10,192 | $31,648 |
| 2024 | $144 | $41,840 | $10,192 | $31,648 |
| 2023 | $1 | $41,840 | $10,192 | $31,648 |
| 2022 | $53 | $35,508 | $10,192 | $25,316 |
| 2021 | $53 | $32,748 | $10,192 | $22,556 |
| 2020 | $384 | $32,748 | $10,192 | $22,556 |
| 2019 | $387 | $32,748 | $10,192 | $22,556 |
| 2018 | $387 | $32,748 | $10,192 | $22,556 |
| 2017 | $444 | $32,748 | $10,192 | $22,556 |
| 2016 | $393 | $22,800 | $1,883 | $20,917 |
| 2015 | $611 | $36,962 | $3,053 | $33,909 |
| 2014 | $611 | $36,962 | $3,053 | $33,909 |
| 2013 | -- | $36,962 | $3,053 | $33,909 |
Source: Public Records
Map
Nearby Homes
- 6620 Cove Cir
- 1826 Woodhollow Dr
- 1607 Mazor Dr
- 1322 Melford Dr
- 1925 Woodhollow Dr
- 1754 Mazor Dr
- 6213 Fitzgerald Dr
- 6188 Valencia Dr
- 6119 Mill Branch Rd
- 6047 Capri Cir
- 6916 Bradshaw Dr
- 6061 Luna Dr
- 6032 Cordova Rd
- 6033 Luna Dr
- 2216 Hunter Ct
- 1111 Richland Dr
- 6040 Luna Dr
- 6223 Georgetown Dr
- 1068 Valencia Dr
- 1252 School House Dr
- 6611 Dorsey Dr
- 6621 Dorsey Dr
- 6620 Dorsey Dr
- 6612 Dorsey Dr
- 6605 Dorsey Dr
- 6627 Dorsey Dr
- 6630 Dorsey Dr
- 6606 Dorsey Dr
- 0 Dorsey Dr
- 6601 Dorsey Dr
- 6633 Dorsey Dr
- 1800 Westpark Dr
- 6600 Dorsey Dr
- 6604 Pine Valley Dr
- 6605 Cove Cir
- 6541 Dorsey Dr
- 6608 Pine Valley Dr
- 6600 Pine Valley Dr
- 1804 Westpark Dr
- 6639 Dorsey Dr