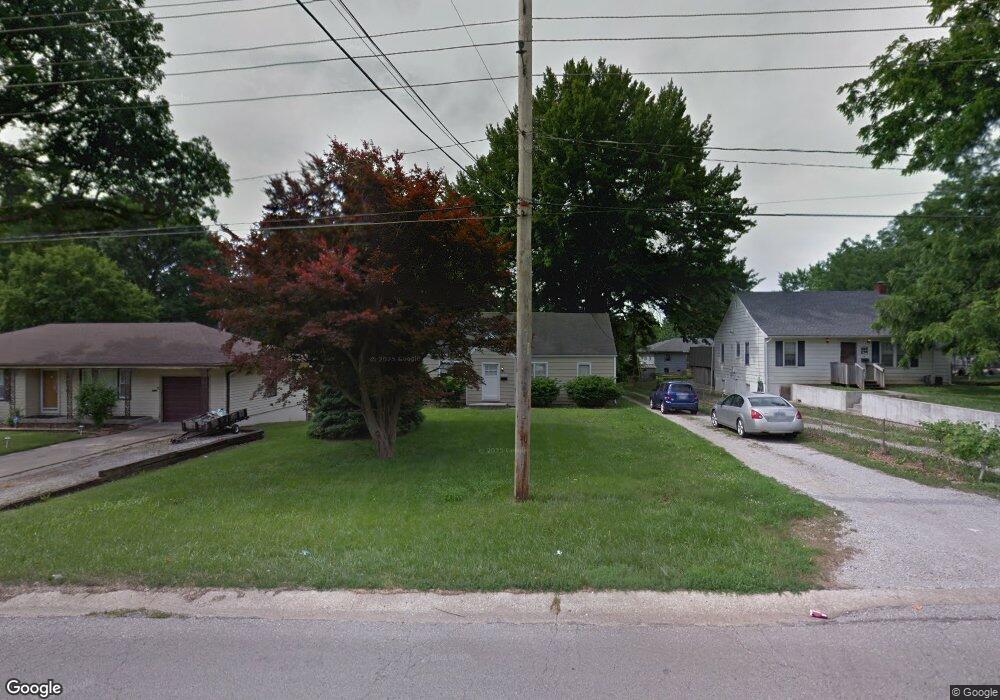
6615 E 99th St Kansas City, MO 64134
Fairlane NeighborhoodEstimated Value: $176,545 - $211,000
4
Beds
2
Baths
1,158
Sq Ft
$170/Sq Ft
Est. Value
About This Home
This home is located at 6615 E 99th St, Kansas City, MO 64134 and is currently estimated at $196,886, approximately $170 per square foot. 6615 E 99th St is a home located in Jackson County with nearby schools including Truman Elementary School, Islamic School of Greater Kansas City, and This Christian School.
Ownership History
Date
Name
Owned For
Owner Type
Purchase Details
Closed on
Dec 6, 2023
Sold by
P Fin Vii Kc Llc
Bought by
Vinebrook Homes Borrower 1 Llc
Current Estimated Value
Purchase Details
Closed on
Jan 23, 2020
Sold by
Csma Blt Llc
Bought by
P Fin Vii Kc Llc
Purchase Details
Closed on
Aug 29, 2002
Sold by
Carr Randall R
Bought by
Butler Terry D and Butler Latundra R
Home Financials for this Owner
Home Financials are based on the most recent Mortgage that was taken out on this home.
Original Mortgage
$79,500
Interest Rate
6.33%
Mortgage Type
Purchase Money Mortgage
Purchase Details
Closed on
Sep 14, 2001
Sold by
Calmco Servicing Lp
Bought by
Carr Randall R
Home Financials for this Owner
Home Financials are based on the most recent Mortgage that was taken out on this home.
Original Mortgage
$56,000
Interest Rate
6.96%
Mortgage Type
Purchase Money Mortgage
Create a Home Valuation Report for This Property
The Home Valuation Report is an in-depth analysis detailing your home's value as well as a comparison with similar homes in the area
Home Values in the Area
Average Home Value in this Area
Purchase History
| Date | Buyer | Sale Price | Title Company |
|---|---|---|---|
| Vinebrook Homes Borrower 1 Llc | -- | None Listed On Document | |
| P Fin Vii Kc Llc | -- | None Available | |
| P Fin Vii Kc Llc | -- | None Available | |
| Butler Terry D | -- | Old Republic Title Co Of Ks | |
| Carr Randall R | -- | First American Title Ins |
Source: Public Records
Mortgage History
| Date | Status | Borrower | Loan Amount |
|---|---|---|---|
| Previous Owner | Butler Terry D | $79,500 | |
| Previous Owner | Carr Randall R | $56,000 |
Source: Public Records
Tax History
| Year | Tax Paid | Tax Assessment Tax Assessment Total Assessment is a certain percentage of the fair market value that is determined by local assessors to be the total taxable value of land and additions on the property. | Land | Improvement |
|---|---|---|---|---|
| 2025 | $1,801 | $22,614 | $3,046 | $19,568 |
| 2024 | $1,801 | $20,809 | $5,913 | $14,896 |
| 2023 | $1,769 | $20,809 | $6,817 | $13,992 |
| 2022 | $1,693 | $17,100 | $3,116 | $13,984 |
| 2021 | $1,461 | $17,100 | $3,116 | $13,984 |
| 2020 | $1,441 | $15,942 | $3,116 | $12,826 |
| 2019 | $1,362 | $15,942 | $3,116 | $12,826 |
| 2018 | $663 | $7,244 | $1,386 | $5,858 |
| 2017 | $663 | $7,244 | $1,386 | $5,858 |
| 2016 | $594 | $6,299 | $2,897 | $3,402 |
| 2014 | $576 | $13,298 | $2,840 | $10,458 |
Source: Public Records
Map
Nearby Homes
- 6702 E 99th Terrace
- 9806 Bennington Ave
- 6810 Fairlane Dr
- 6302 E 102nd St
- 10201 Belmont Ave
- 6302 Fairlane Dr
- 5904 E 100th St
- 10109 White Ave
- 7200 E 102nd St
- 6212 E 95th Terrace
- 7620 E 100th St
- 10302 Oakland Ave
- 5411 E 100th St
- 9826 Hardesty Ave
- 10008 Hardesty Ave
- 7611 E 100th Terrace
- 9810 Hardesty Ave
- 10303 Richmond Ave
- 7621 E Bannister Rd
- 9700 Hardesty Ave
- 6701 E 99th St
- 6611 E 99th St
- 6703 E 99th St
- 6600 E 99th Terrace
- 6700 E 99th Terrace
- 6705 E 99th St
- 6519 E 99th St
- 9818 Newton Ave
- 9904 Bennington Ave
- 9823 Newton Ave
- 9819 Bennington Ave
- 9820 Bennington Ave
- 6704 E 99th Terrace
- 9821 Newton Ave
- 9906 Bennington Ave
- 6707 E 99th St
- 6603 E 99th Terrace
- 6701 E 99th Terrace
- 9818 Bennington Ave
- 6601 E 99th Terrace
Your Personal Tour Guide
Ask me questions while you tour the home.