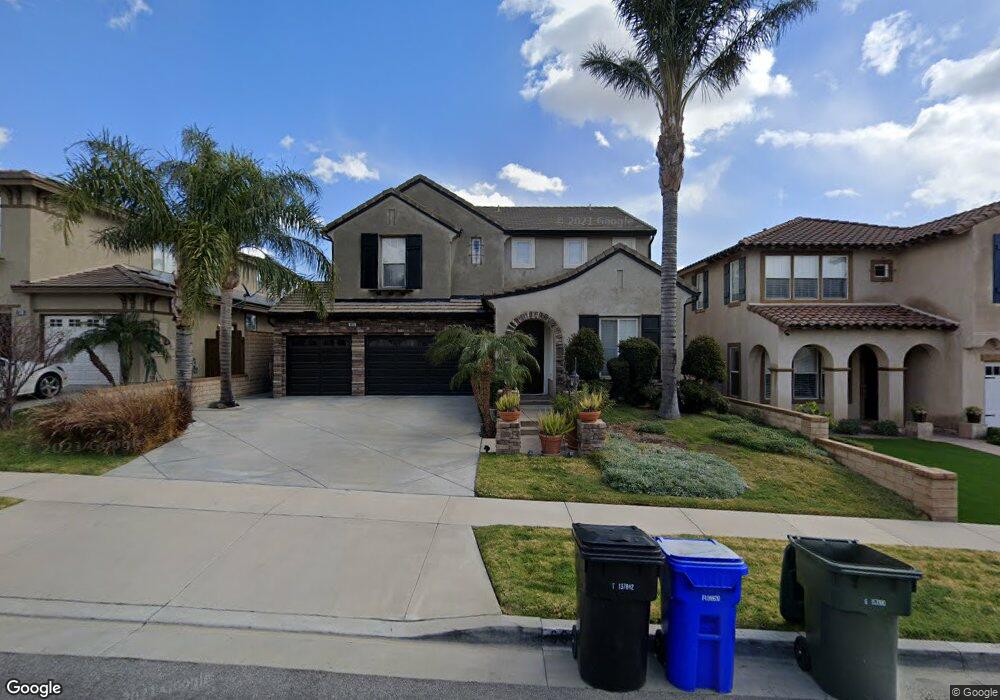
6615 Vianza Place Rancho Cucamonga, CA 91701
Victoria NeighborhoodEstimated Value: $972,187 - $1,038,000
4
Beds
3
Baths
2,722
Sq Ft
$370/Sq Ft
Est. Value
About This Home
This home is located at 6615 Vianza Place, Rancho Cucamonga, CA 91701 and is currently estimated at $1,006,047, approximately $369 per square foot. 6615 Vianza Place is a home located in San Bernardino County with nearby schools including Carleton P. Lightfoot Elementary, Day Creek Intermediate, and Rancho Cucamonga High School.
Ownership History
Date
Name
Owned For
Owner Type
Purchase Details
Closed on
Feb 14, 2007
Sold by
Rosas Rosas Ana Bertha Ana Bertha
Bought by
Rosas Ana Bertha
Current Estimated Value
Purchase Details
Closed on
Jan 29, 2007
Sold by
Villa Jose Rosas
Bought by
Rosas Ana Bertha
Purchase Details
Closed on
Apr 4, 2005
Sold by
Rosas Villa Jose Rosas
Bought by
Jose Rosas Villa & Ana Bertha Rosas Vill
Purchase Details
Closed on
Dec 12, 2001
Sold by
Premier Rancho Cucamonga 77 Ltd
Bought by
Orejel Lorenzo
Home Financials for this Owner
Home Financials are based on the most recent Mortgage that was taken out on this home.
Original Mortgage
$289,000
Interest Rate
6.51%
Create a Home Valuation Report for This Property
The Home Valuation Report is an in-depth analysis detailing your home's value as well as a comparison with similar homes in the area
Home Values in the Area
Average Home Value in this Area
Purchase History
| Date | Buyer | Sale Price | Title Company |
|---|---|---|---|
| Rosas Ana Bertha | -- | Advantage Title Inc | |
| Rosas Ana Bertha | -- | Advantage Title Inc | |
| Jose Rosas Villa & Ana Bertha Rosas Vill | -- | -- | |
| Orejel Lorenzo | $305,000 | Orange Coast Title |
Source: Public Records
Mortgage History
| Date | Status | Borrower | Loan Amount |
|---|---|---|---|
| Previous Owner | Orejel Lorenzo | $289,000 |
Source: Public Records
Tax History Compared to Growth
Tax History
| Year | Tax Paid | Tax Assessment Tax Assessment Total Assessment is a certain percentage of the fair market value that is determined by local assessors to be the total taxable value of land and additions on the property. | Land | Improvement |
|---|---|---|---|---|
| 2025 | $6,260 | $450,581 | $112,645 | $337,936 |
| 2024 | $6,260 | $441,746 | $110,436 | $331,310 |
| 2023 | $6,111 | $433,085 | $108,271 | $324,814 |
| 2022 | $6,026 | $424,593 | $106,148 | $318,445 |
| 2021 | $5,932 | $416,268 | $104,067 | $312,201 |
| 2020 | $5,871 | $412,000 | $103,000 | $309,000 |
| 2019 | $5,745 | $403,921 | $100,980 | $302,941 |
| 2018 | $5,736 | $396,001 | $99,000 | $297,001 |
| 2017 | $5,518 | $388,236 | $97,059 | $291,177 |
| 2016 | $5,386 | $380,624 | $95,156 | $285,468 |
| 2015 | $5,348 | $374,907 | $93,727 | $281,180 |
| 2014 | $5,230 | $367,563 | $91,891 | $275,672 |
Source: Public Records
Map
Nearby Homes
- 11855 Modena Dr
- 11839 Antler Peak Ct
- 6530 Catania Place
- 6419 Panorama Ct
- 6701 Marsala Place
- 11571 Pinnacle Peak Ct
- 6988 Edinburgh Place
- 11530 Marcello Way
- 6872 Landriano Place
- 11948 Stegmeir Dr
- 7070 Pozallo Place
- 6393 Kettle Peak Place
- 11537 Mount Hood Ct
- 12164 Wembley Ct
- 6999 Canosa Place
- 12331 Dove Tree Dr
- 12356 Thistle Dr
- 11376 Starlight Dr
- 7139 Scalea Place
- 11344 Sunrise Ct
- 6627 Vianza Place
- 6611 Vianza Place
- 6631 Vianza Place
- 6643 Vianza Place
- 6589 Vianza Place
- 6614 Vianza Place
- 6608 Vianza Place
- 6628 Vianza Place
- 6647 Vianza Place
- 6632 Vianza Place
- 6587 Vianza Place
- 6588 Vianza Place
- 6644 Vianza Place
- 6655 Vianza Place
- 6573 Vianza Place
- 6584 Vianza Place
- 6611 Veneto Place
- 6615 Veneto Place
- 6648 Vianza Place
- 6629 Veneto Place