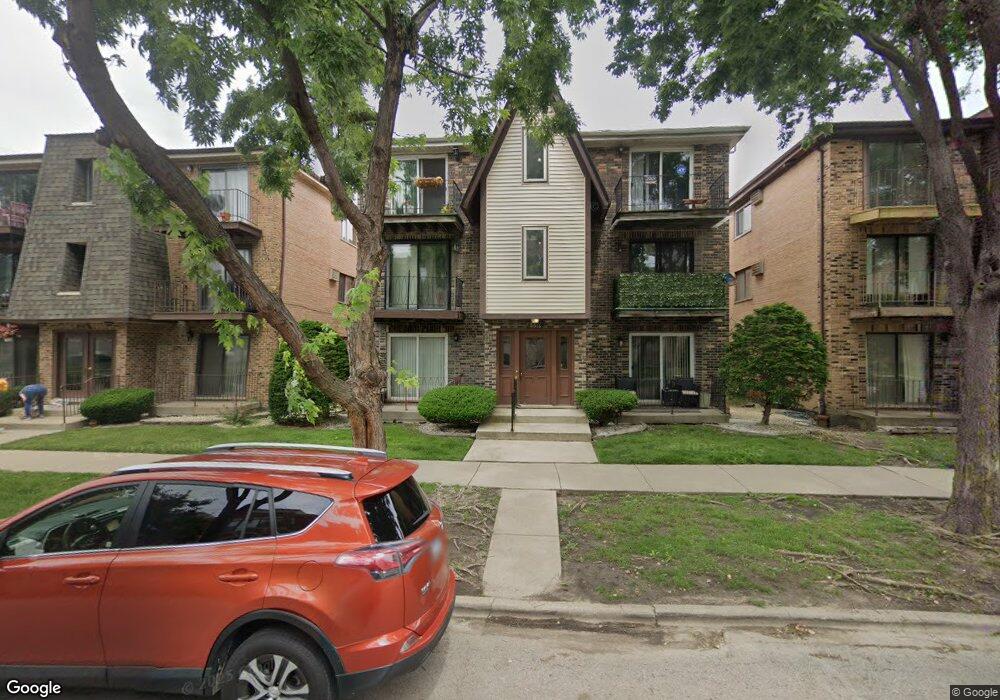
6616 W 64th Place Unit 3A Chicago, IL 60638
Clearing NeighborhoodEstimated Value: $136,000 - $179,000
2
Beds
1
Bath
1,100
Sq Ft
$150/Sq Ft
Est. Value
About This Home
This home is located at 6616 W 64th Place Unit 3A, Chicago, IL 60638 and is currently estimated at $164,802, approximately $149 per square foot. 6616 W 64th Place Unit 3A is a home located in Cook County with nearby schools including Dore Elementary School, Kennedy High School, and St. Symphorosa Catholic School.
Ownership History
Date
Name
Owned For
Owner Type
Purchase Details
Closed on
Oct 10, 2012
Sold by
Greco Michael J
Bought by
Kalinowski Krzysztof
Current Estimated Value
Purchase Details
Closed on
Sep 20, 2005
Sold by
Rykala Thomas A and Rykala Elizabeth
Bought by
Greco Michael J
Home Financials for this Owner
Home Financials are based on the most recent Mortgage that was taken out on this home.
Original Mortgage
$126,000
Interest Rate
7.6%
Mortgage Type
Purchase Money Mortgage
Purchase Details
Closed on
Dec 9, 1998
Sold by
Zblut Elzbieta and Hawron Elzbieta
Bought by
Rykala Thomas A and Rykala Elzbieta
Home Financials for this Owner
Home Financials are based on the most recent Mortgage that was taken out on this home.
Original Mortgage
$56,250
Interest Rate
6.75%
Create a Home Valuation Report for This Property
The Home Valuation Report is an in-depth analysis detailing your home's value as well as a comparison with similar homes in the area
Home Values in the Area
Average Home Value in this Area
Purchase History
| Date | Buyer | Sale Price | Title Company |
|---|---|---|---|
| Kalinowski Krzysztof | $50,000 | First American Title | |
| Greco Michael J | $157,500 | First American Title | |
| Rykala Thomas A | $75,000 | -- |
Source: Public Records
Mortgage History
| Date | Status | Borrower | Loan Amount |
|---|---|---|---|
| Previous Owner | Greco Michael J | $126,000 | |
| Previous Owner | Rykala Thomas A | $56,250 |
Source: Public Records
Tax History Compared to Growth
Tax History
| Year | Tax Paid | Tax Assessment Tax Assessment Total Assessment is a certain percentage of the fair market value that is determined by local assessors to be the total taxable value of land and additions on the property. | Land | Improvement |
|---|---|---|---|---|
| 2024 | $2,192 | $13,110 | $1,322 | $11,788 |
| 2023 | $2,138 | $10,336 | $1,180 | $9,156 |
| 2022 | $2,138 | $10,336 | $1,180 | $9,156 |
| 2021 | $2,078 | $10,334 | $1,179 | $9,155 |
| 2020 | $1,853 | $8,265 | $943 | $7,322 |
| 2019 | $1,860 | $9,199 | $943 | $8,256 |
| 2018 | $1,829 | $9,199 | $943 | $8,256 |
| 2017 | $1,744 | $8,047 | $849 | $7,198 |
| 2016 | $1,622 | $8,047 | $849 | $7,198 |
| 2015 | $1,485 | $8,047 | $849 | $7,198 |
| 2014 | $1,298 | $6,941 | $802 | $6,139 |
| 2013 | $1,273 | $6,941 | $802 | $6,139 |
Source: Public Records
Map
Nearby Homes
- 6637 W 64th Place
- 6659 W 64th Place Unit 305
- 6419 S Oak Park Ave Unit E-25
- 6206 S Nashville Ave
- 6430 W 64th Place
- 6416 W 64th Place Unit 3A
- 6850 W 64th St
- 6857 W 63rd Place
- 6401 W 64th Place Unit 2W
- 6927 W 64th Place Unit 2E
- 6104 S Nashville Ave
- 6322 W 63rd Place
- 6031 S Normandy Ave
- 6020 S Nashville Ave
- 5950 S Natoma Ave
- 6154 W 63rd St Unit 3W
- 6120 W 65th St Unit 5
- 6046 S Melvina Ave
- 6054 W 64th St
- 5820 S Rutherford Ave
- 6616 W 64th Place Unit 2A
- 6616 W 64th Place Unit 3B
- 6616 W 64th Place Unit 1B
- 6616 W 64th Place Unit 1A
- 6616 W 64th Place Unit 2B
- 6616 W 64th Place Unit 3W
- 6616 W 64th Place Unit 2E
- 6616 W 64th Place
- 6616 W 64th Place Unit 3E
- 6616 W 64th Place Unit 1E
- 6616 W 64th Place Unit 2W
- 6620 W 64th Place Unit 3E
- 6620 W 64th Place Unit 1B
- 6620 W 64th Place Unit 3B
- 6620 W 64th Place Unit 2B
- 6620 W 64th Place Unit 2A
- 6620 W 64th Place Unit 3A
- 6620 W 64th Place Unit 1A
- 6620 W 64th Place Unit 2W
- 6620 W 64th Place Unit 1W