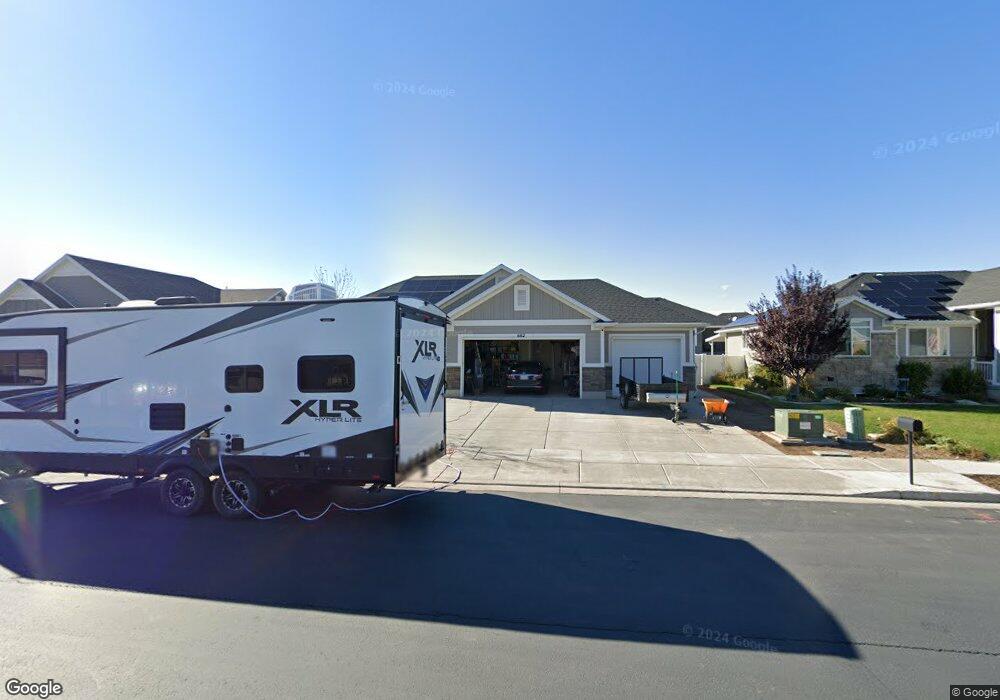
662 S 3250 W Syracuse, UT 84075
Estimated Value: $601,000 - $701,000
3
Beds
2
Baths
3,224
Sq Ft
$201/Sq Ft
Est. Value
About This Home
This home is located at 662 S 3250 W, Syracuse, UT 84075 and is currently estimated at $649,108, approximately $201 per square foot. 662 S 3250 W is a home located in Davis County with nearby schools including West Point School, West Point Junior High School, and Syracuse High School.
Ownership History
Date
Name
Owned For
Owner Type
Purchase Details
Closed on
Jan 11, 2021
Sold by
Mifflin Max H
Bought by
Mifflin Max H and Max H Mifflin Of Family Trust
Current Estimated Value
Home Financials for this Owner
Home Financials are based on the most recent Mortgage that was taken out on this home.
Original Mortgage
$300,000
Outstanding Balance
$267,137
Interest Rate
2.71%
Mortgage Type
New Conventional
Estimated Equity
$381,971
Purchase Details
Closed on
Nov 22, 2017
Sold by
Mifflin Max H
Bought by
Mifflin Max H and Mifflin Family Trust
Purchase Details
Closed on
Apr 21, 2017
Sold by
Lynn Glauser Constrution Lc
Bought by
Mifflin Max H
Home Financials for this Owner
Home Financials are based on the most recent Mortgage that was taken out on this home.
Original Mortgage
$260,000
Interest Rate
4.23%
Mortgage Type
New Conventional
Create a Home Valuation Report for This Property
The Home Valuation Report is an in-depth analysis detailing your home's value as well as a comparison with similar homes in the area
Home Values in the Area
Average Home Value in this Area
Purchase History
| Date | Buyer | Sale Price | Title Company |
|---|---|---|---|
| Mifflin Max H | -- | Cottonwood Title | |
| Mifflin Max H | -- | Cottonwood Title | |
| Mifflin Max H | -- | -- | |
| Mifflin Max H | -- | Security Title |
Source: Public Records
Mortgage History
| Date | Status | Borrower | Loan Amount |
|---|---|---|---|
| Open | Mifflin Max H | $300,000 | |
| Previous Owner | Mifflin Max H | $260,000 |
Source: Public Records
Tax History Compared to Growth
Tax History
| Year | Tax Paid | Tax Assessment Tax Assessment Total Assessment is a certain percentage of the fair market value that is determined by local assessors to be the total taxable value of land and additions on the property. | Land | Improvement |
|---|---|---|---|---|
| 2025 | $3,483 | $336,050 | $120,822 | $215,228 |
| 2024 | $3,290 | $319,550 | $96,127 | $223,423 |
| 2023 | $3,108 | $550,000 | $134,155 | $415,845 |
| 2022 | $3,214 | $311,850 | $77,739 | $234,111 |
| 2021 | $2,889 | $434,000 | $114,455 | $319,545 |
| 2020 | $2,764 | $402,000 | $101,601 | $300,399 |
| 2019 | $2,438 | $350,000 | $96,995 | $253,005 |
| 2018 | $2,281 | $325,000 | $94,914 | $230,086 |
| 2016 | $888 | $66,391 | $66,391 | $0 |
Source: Public Records
Map
Nearby Homes
- 851 S 3525 W
- 3565 W 800 S
- 3649 W 800 S
- 3661 W 800 S
- 3627 W Augusta Dr
- 164 S 2875 W
- 2840 W 1200 S
- 1159 S 4350 W
- 2633 N 2080 W Unit 180
- 2623 N 2080 W Unit 178
- 380 S 4300 W Unit 608
- 997 N 5100 W Unit 213
- 2619 N 2080 W Unit 177
- 2627 N 2080 W Unit 179
- 3232 W 375 N Unit 7
- 3258 W 375 N Unit 9
- 260 W Antelope Dr S
- 4200 W 800 N
- 1441 Brookshire Dr
- 3736 W 1225 S
- 662 S Thurgood Ln
- 644 S Thurgood Ln
- 678 W 3250 S Unit 213
- 657 S 3275 W
- 673 S 3275 W
- 3256 W 700 S
- 628 S Thurgood Ln
- 629 S 3275 W
- 3266 W 700 S
- 3264 W 700 S Unit 215
- 3264 W 700 S
- 647 S Thurgood Ln
- 3272 W 700 S
- 3228 W 700 S
- 613 S 3275 W Unit 116
- 612 S Thurgood Ln Unit 209
- 631 Thurgood Ln
- 676 S 3275 W
- 3278 W 700 S
- 3214 W 700 S