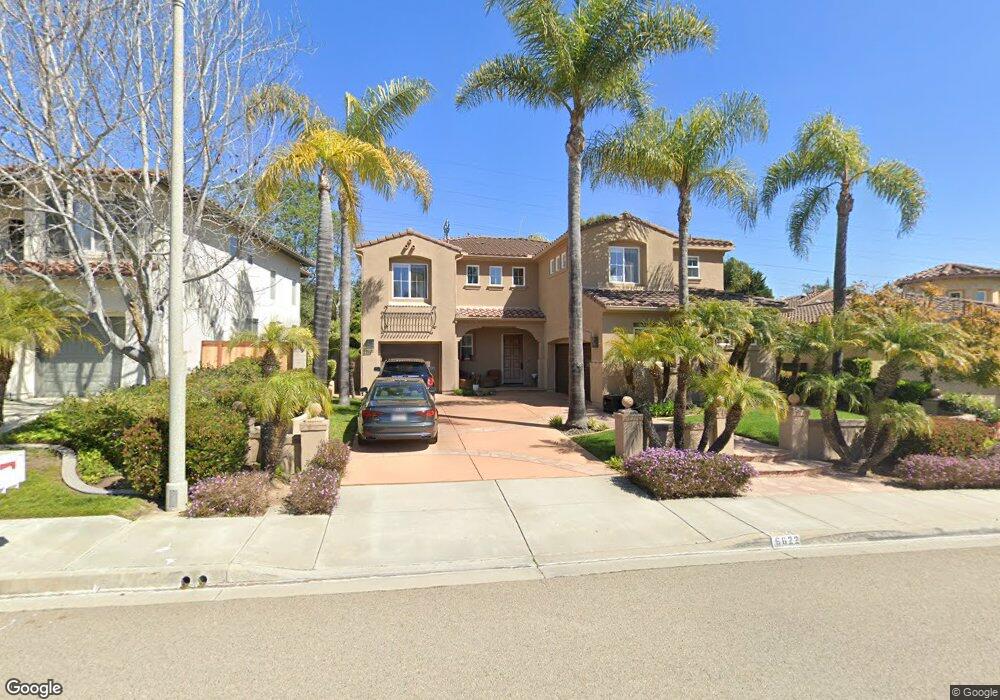
6622 Fiona Place Carlsbad, CA 92011
Aviara NeighborhoodEstimated Value: $2,057,942 - $2,241,000
4
Beds
4
Baths
3,697
Sq Ft
$590/Sq Ft
Est. Value
About This Home
This home is located at 6622 Fiona Place, Carlsbad, CA 92011 and is currently estimated at $2,180,736, approximately $589 per square foot. 6622 Fiona Place is a home located in San Diego County with nearby schools including Aviara Oaks Elementary, Aviara Oaks Middle, and Sage Creek High.
Ownership History
Date
Name
Owned For
Owner Type
Purchase Details
Closed on
Dec 29, 2009
Sold by
Desantis Paul John and Mcgee Laura
Bought by
Laws Scott W and Laws Mary
Current Estimated Value
Purchase Details
Closed on
Dec 8, 2006
Sold by
Yongyuth Arms and Yongyuth Helen E
Bought by
Desantis Paul John and Mcgee Laura
Home Financials for this Owner
Home Financials are based on the most recent Mortgage that was taken out on this home.
Original Mortgage
$496,000
Interest Rate
5.62%
Mortgage Type
Purchase Money Mortgage
Purchase Details
Closed on
Aug 3, 2000
Sold by
Brehm Aviara Iii Development Associates
Bought by
Yongyuth Arms and Yongyuth Helen E
Home Financials for this Owner
Home Financials are based on the most recent Mortgage that was taken out on this home.
Original Mortgage
$252,000
Interest Rate
8.16%
Create a Home Valuation Report for This Property
The Home Valuation Report is an in-depth analysis detailing your home's value as well as a comparison with similar homes in the area
Home Values in the Area
Average Home Value in this Area
Purchase History
| Date | Buyer | Sale Price | Title Company |
|---|---|---|---|
| Laws Scott W | $839,000 | Stewart Title Of Ca Inc | |
| Desantis Paul John | $950,000 | New Century Title Company | |
| Yongyuth Arms | $499,000 | Chicago Title Co |
Source: Public Records
Mortgage History
| Date | Status | Borrower | Loan Amount |
|---|---|---|---|
| Previous Owner | Desantis Paul John | $496,000 | |
| Previous Owner | Yongyuth Arms | $252,000 | |
| Closed | Yongyuth Arms | $50,000 |
Source: Public Records
Tax History Compared to Growth
Tax History
| Year | Tax Paid | Tax Assessment Tax Assessment Total Assessment is a certain percentage of the fair market value that is determined by local assessors to be the total taxable value of land and additions on the property. | Land | Improvement |
|---|---|---|---|---|
| 2025 | $11,353 | $1,082,979 | $433,190 | $649,789 |
| 2024 | $11,353 | $1,061,746 | $424,697 | $637,049 |
| 2023 | $11,295 | $1,040,928 | $416,370 | $624,558 |
| 2022 | $11,120 | $1,020,518 | $408,206 | $612,312 |
| 2021 | $11,036 | $1,000,508 | $400,202 | $600,306 |
| 2020 | $10,961 | $990,250 | $396,099 | $594,151 |
| 2019 | $10,762 | $970,834 | $388,333 | $582,501 |
| 2018 | $10,331 | $951,799 | $380,719 | $571,080 |
| 2017 | $90 | $933,137 | $373,254 | $559,883 |
| 2016 | $9,757 | $914,841 | $365,936 | $548,905 |
| 2015 | $9,717 | $901,100 | $360,440 | $540,660 |
| 2014 | $10,096 | $883,450 | $353,380 | $530,070 |
Source: Public Records
Map
Nearby Homes
- 6325 Alexandri Cir
- 6647 Encelia Place
- 6377 Alexandri Cir
- 6485 Alexandri Cir
- 6467 Alexandri Cir Unit 75
- 6419 Alexandri Cir
- 6438 Lilium Ln
- 6903 Quail Place
- 1845 Cliff Swallow Ln
- 1736 Blackbird Cir
- 6911 Quail Place Unit C
- 7012 Goldenrod Way
- 6901 Tourmaline Place
- 6777 Lonicera St
- 6557 Coneflower Dr
- 1933 Alga Rd Unit C
- 7212 Columbine Dr
- 7019 Estrella de Mar Rd
- 7021 Estrella de Mar Rd
- 7026 Estrella de Mar Rd
- 6618 Fiona Place
- 6626 Fiona Place
- 6614 Fiona Place
- 1690 Docena Rd
- 1694 Docena Rd
- 6610 Fiona Place
- 6631 Fiona Place
- 1698 Docena Rd Unit 5
- 6627 Fiona Place
- 6623 Fiona Place
- 6635 Fiona Place
- 6619 Fiona Place
- 6606 Fiona Place
- 6615 Fiona Place
- 1674 Docena Rd
- 6602 Fiona Place
- 6611 Fiona Place
- 1685 Docena Rd
- 1693 Docena Rd
- 1681 Docena Rd