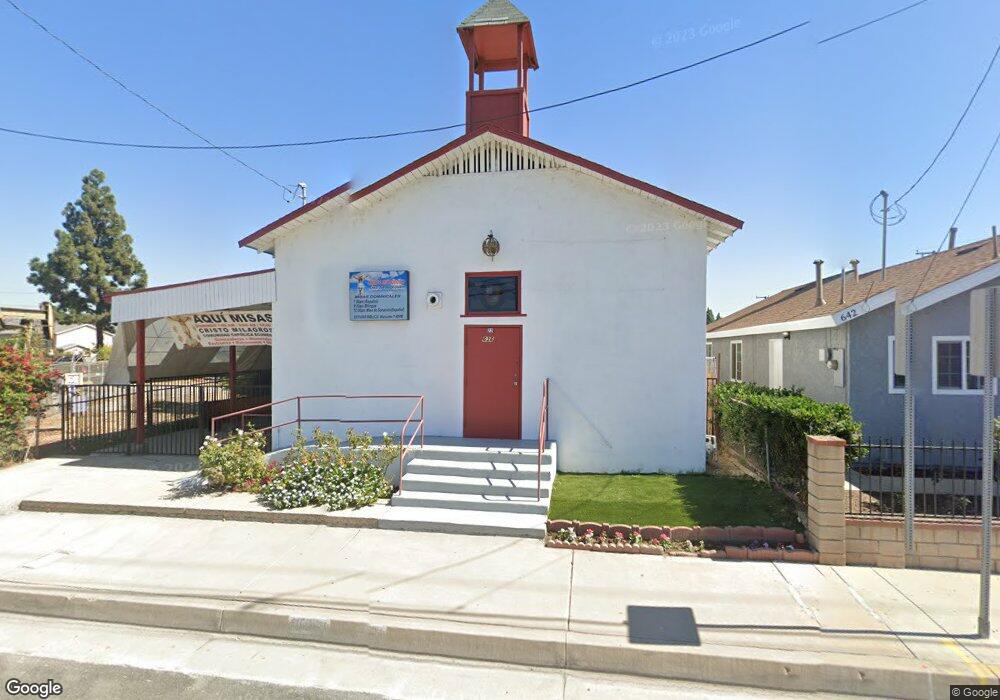
6622 S Van Buren St Placentia, CA 92870
Estimated Value: $568,664
--
Bed
--
Bath
--
Sq Ft
3,920
Sq Ft Lot
About This Home
This home is located at 6622 S Van Buren St, Placentia, CA 92870 and is currently estimated at $568,664. 6622 S Van Buren St is a home located in Orange County with nearby schools including Glenview Elementary School, Bernardo Yorba Middle School, and Independence Christian School.
Ownership History
Date
Name
Owned For
Owner Type
Purchase Details
Closed on
Feb 6, 2019
Sold by
Murcia Alba Consuelo Ballen
Bought by
Colmenares Adolfo Perez
Current Estimated Value
Home Financials for this Owner
Home Financials are based on the most recent Mortgage that was taken out on this home.
Original Mortgage
$227,500
Outstanding Balance
$199,198
Interest Rate
4.4%
Mortgage Type
New Conventional
Estimated Equity
$374,617
Purchase Details
Closed on
Jan 22, 2019
Sold by
Church Saint Joseph
Bought by
Colmenares Adolfo Perez
Home Financials for this Owner
Home Financials are based on the most recent Mortgage that was taken out on this home.
Original Mortgage
$227,500
Outstanding Balance
$199,198
Interest Rate
4.4%
Mortgage Type
New Conventional
Estimated Equity
$374,617
Purchase Details
Closed on
Jun 26, 2012
Sold by
The Roman Catholic Bishop Of Orange
Bought by
Church Saint Joseph
Create a Home Valuation Report for This Property
The Home Valuation Report is an in-depth analysis detailing your home's value as well as a comparison with similar homes in the area
Home Values in the Area
Average Home Value in this Area
Purchase History
| Date | Buyer | Sale Price | Title Company |
|---|---|---|---|
| Colmenares Adolfo Perez | -- | First American Title Company | |
| Colmenares Adolfo Perez | $350,000 | First American Title Company | |
| Church Saint Joseph | -- | Fidelity National Title |
Source: Public Records
Mortgage History
| Date | Status | Borrower | Loan Amount |
|---|---|---|---|
| Open | Colmenares Adolfo Perez | $227,500 |
Source: Public Records
Tax History Compared to Growth
Tax History
| Year | Tax Paid | Tax Assessment Tax Assessment Total Assessment is a certain percentage of the fair market value that is determined by local assessors to be the total taxable value of land and additions on the property. | Land | Improvement |
|---|---|---|---|---|
| 2025 | $4,442 | $390,429 | $312,345 | $78,084 |
| 2024 | $4,442 | $382,774 | $306,221 | $76,553 |
| 2023 | $4,366 | $375,269 | $300,217 | $75,052 |
| 2022 | $4,331 | $367,911 | $294,330 | $73,581 |
| 2021 | $4,260 | $360,698 | $288,559 | $72,139 |
| 2020 | $4,270 | $357,000 | $285,600 | $71,400 |
| 2019 | $358 | $32,691 | $9,897 | $22,794 |
| 2018 | $354 | $32,050 | $9,702 | $22,348 |
| 2017 | $349 | $31,422 | $9,512 | $21,910 |
| 2016 | $345 | $30,806 | $9,325 | $21,481 |
| 2015 | $340 | $30,344 | $9,185 | $21,159 |
| 2014 | $333 | $29,750 | $9,005 | $20,745 |
Source: Public Records
Map
Nearby Homes
- 1645 La Paloma Ave
- 1570 Topeka Ave
- 1572 Lima Way Unit 6
- 1563 Lima Way Unit 5
- 1578 Topeka Ave Unit 2
- Plan One Y at Hudson
- Plan Three Y at Hudson
- Plan Three at Hudson
- PLan Three X at Hudson
- Plan One at Hudson
- Plan Two Y at Hudson
- 1663 Oak St
- 1553 Lima Way Unit 2
- 361 S Van Buren St Unit B
- 1507 E Spruce St Unit A
- 1833 Taft Ln
- 1561 Ismail Place
- 1952 Avenida Del Sol
- 1958 Avenida Del Sol
- 1664 Via de la Luna
- 642 S Van Buren St
- 1605 Sierra Vista Ave
- 1604 La Paloma Ave
- 1609 Sierra Vista Ave
- 1608 La Paloma Ave
- 1613 Sierra Vista Ave
- 1614 La Paloma Ave
- 1617 Sierra Vista Ave
- 1603 La Paloma Ave
- 1616 La Paloma Ave
- 1621 Sierra Vista Ave
- 1607 La Paloma Ave
- 1620 La Paloma Ave
- 17000 La Paloma Ave
- 1625 Sierra Vista Ave
- 1624 La Paloma Ave
- 606 S Van Buren St
- 1629 Sierra Vista Ave
- 1628 La Paloma Ave
- 1604 Vincente Ave