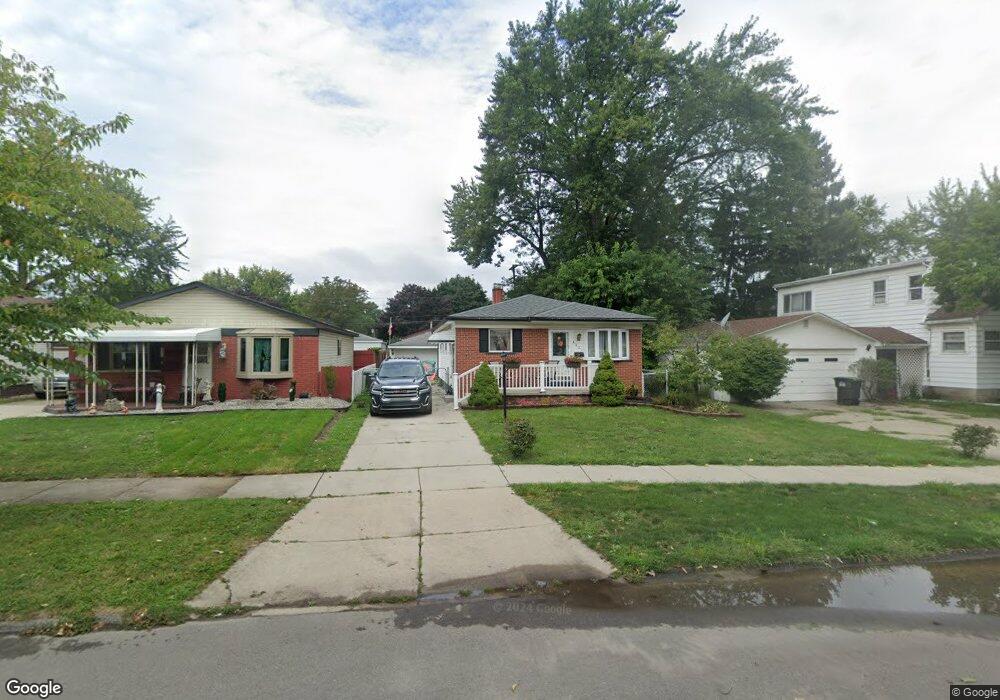
6624 Pine St Taylor, MI 48180
Estimated Value: $153,000 - $161,000
3
Beds
1
Bath
850
Sq Ft
$184/Sq Ft
Est. Value
About This Home
This home is located at 6624 Pine St, Taylor, MI 48180 and is currently estimated at $156,357, approximately $183 per square foot. 6624 Pine St is a home located in Wayne County with nearby schools including Clarence Randall Elementary School, Hoover Middle School, and Quest Charter Academy.
Ownership History
Date
Name
Owned For
Owner Type
Purchase Details
Closed on
Oct 12, 2021
Sold by
Nester Timothy A
Bought by
Mullins Shelby J and Mullins Brandon
Current Estimated Value
Purchase Details
Closed on
Jul 24, 2013
Sold by
Nester Gilbert R and Nester Marie L
Bought by
Nester Gilbert R and Nester Marie L
Purchase Details
Closed on
Sep 13, 2011
Sold by
Braden Diane L
Bought by
The Federal National Mortgage Corporatio
Purchase Details
Closed on
Aug 11, 2011
Sold by
Braden Diane L and Wells Fargo Bank Na
Bought by
The Federal Home Loan Mortgage Corporati
Purchase Details
Closed on
May 6, 2002
Sold by
Pike David B
Bought by
Braden Diane L
Home Financials for this Owner
Home Financials are based on the most recent Mortgage that was taken out on this home.
Original Mortgage
$90,300
Interest Rate
6.91%
Purchase Details
Closed on
Jun 6, 1995
Sold by
Leon R Kroeger
Bought by
Pike David B and Pike Debra A
Create a Home Valuation Report for This Property
The Home Valuation Report is an in-depth analysis detailing your home's value as well as a comparison with similar homes in the area
Home Values in the Area
Average Home Value in this Area
Purchase History
| Date | Buyer | Sale Price | Title Company |
|---|---|---|---|
| Mullins Shelby J | -- | None Available | |
| Nester Gilbert R | -- | None Available | |
| The Federal National Mortgage Corporatio | -- | E Title | |
| The Federal Home Loan Mortgage Corporati | $95,111 | None Available | |
| Braden Diane L | $112,900 | -- | |
| Pike David B | $65,900 | -- |
Source: Public Records
Mortgage History
| Date | Status | Borrower | Loan Amount |
|---|---|---|---|
| Previous Owner | Braden Diane L | $90,300 | |
| Closed | Mullins Shelby J | $0 |
Source: Public Records
Tax History
| Year | Tax Paid | Tax Assessment Tax Assessment Total Assessment is a certain percentage of the fair market value that is determined by local assessors to be the total taxable value of land and additions on the property. | Land | Improvement |
|---|---|---|---|---|
| 2025 | $2,480 | $72,500 | $0 | $0 |
| 2024 | $2,401 | $63,800 | $0 | $0 |
| 2023 | $2,857 | $56,500 | $0 | $0 |
| 2022 | $2,291 | $50,200 | $0 | $0 |
| 2021 | $1,427 | $46,200 | $0 | $0 |
| 2020 | $1,412 | $41,700 | $0 | $0 |
| 2019 | $141,206 | $34,300 | $0 | $0 |
| 2018 | $1,111 | $27,500 | $0 | $0 |
| 2017 | $610 | $28,000 | $0 | $0 |
| 2016 | $1,378 | $27,200 | $0 | $0 |
| 2015 | $2,510 | $25,100 | $0 | $0 |
| 2013 | $2,540 | $26,500 | $0 | $0 |
| 2012 | $1,133 | $25,800 | $7,300 | $18,500 |
Source: Public Records
Map
Nearby Homes
Your Personal Tour Guide
Ask me questions while you tour the home.