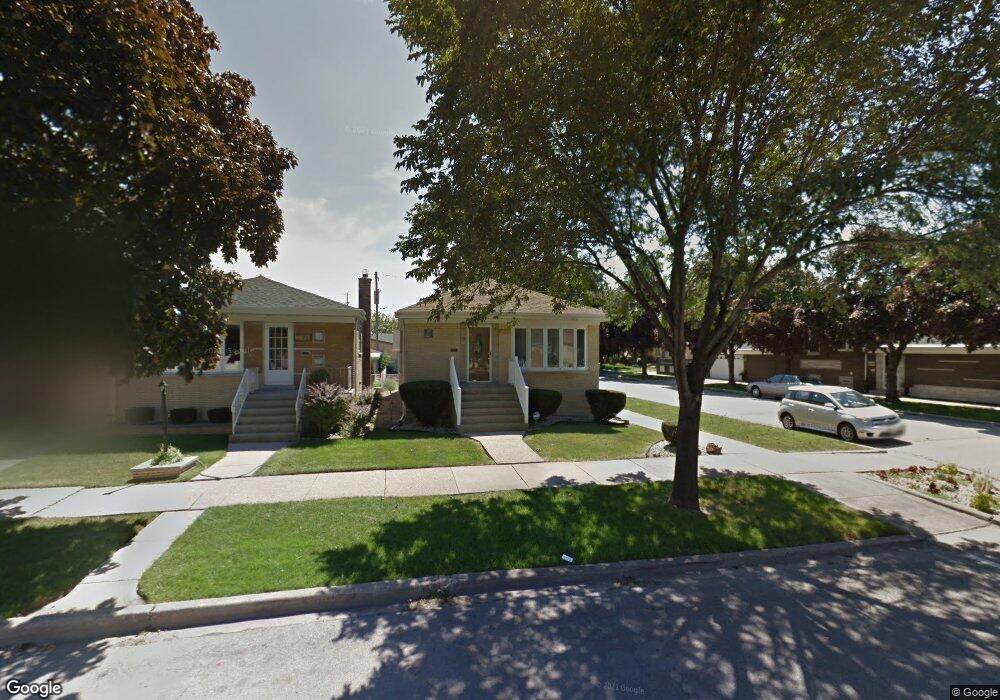
6625 W 59th St Chicago, IL 60638
Garfield Ridge NeighborhoodEstimated Value: $342,000 - $371,000
3
Beds
2
Baths
1,032
Sq Ft
$345/Sq Ft
Est. Value
About This Home
This home is located at 6625 W 59th St, Chicago, IL 60638 and is currently estimated at $356,027, approximately $344 per square foot. 6625 W 59th St is a home located in Cook County with nearby schools including Byrne Elementary School, Kennedy High School, and St Daniel The Prophet School.
Ownership History
Date
Name
Owned For
Owner Type
Purchase Details
Closed on
Sep 13, 2014
Sold by
Alvarado Ignacio and Alvarado Nicole
Bought by
Alvarado Ignacio and Alvarado Nicole
Current Estimated Value
Home Financials for this Owner
Home Financials are based on the most recent Mortgage that was taken out on this home.
Original Mortgage
$242,266
Outstanding Balance
$162,053
Interest Rate
4.12%
Mortgage Type
FHA
Estimated Equity
$193,974
Purchase Details
Closed on
Apr 22, 2009
Sold by
Sikora Jacek and Sikora Danuta
Bought by
Alvarado Ignacio and Grooms Nicole
Home Financials for this Owner
Home Financials are based on the most recent Mortgage that was taken out on this home.
Original Mortgage
$269,037
Interest Rate
5.05%
Mortgage Type
FHA
Purchase Details
Closed on
Mar 2, 2002
Sold by
Piwowarczyk Halina
Bought by
Sikora Jacek and Sikora Danuta
Purchase Details
Closed on
Dec 10, 1998
Sold by
Piwowarczyk Gregory S and Claussen Roslyn A
Bought by
Piwowarczyk Halina
Purchase Details
Closed on
Jul 31, 1998
Sold by
Claussen Roslyn A
Bought by
Piwowarczyk Haline and Piwowarczyk Gregory S
Create a Home Valuation Report for This Property
The Home Valuation Report is an in-depth analysis detailing your home's value as well as a comparison with similar homes in the area
Home Values in the Area
Average Home Value in this Area
Purchase History
| Date | Buyer | Sale Price | Title Company |
|---|---|---|---|
| Alvarado Ignacio | -- | Carrington Title | |
| Alvarado Ignacio | $274,000 | Ticor | |
| Sikora Jacek | -- | -- | |
| Piwowarczyk Halina | -- | -- | |
| Piwowarczyk Haline | -- | -- |
Source: Public Records
Mortgage History
| Date | Status | Borrower | Loan Amount |
|---|---|---|---|
| Open | Alvarado Ignacio | $242,266 | |
| Closed | Alvarado Ignacio | $269,037 |
Source: Public Records
Tax History
| Year | Tax Paid | Tax Assessment Tax Assessment Total Assessment is a certain percentage of the fair market value that is determined by local assessors to be the total taxable value of land and additions on the property. | Land | Improvement |
|---|---|---|---|---|
| 2025 | $4,388 | $26,325 | $5,076 | $21,249 |
| 2024 | $4,388 | $26,325 | $5,076 | $21,249 |
| 2023 | $4,257 | $24,001 | $4,533 | $19,468 |
| 2022 | $4,257 | $24,001 | $4,533 | $19,468 |
| 2021 | $4,156 | $23,999 | $4,532 | $19,467 |
| 2020 | $4,267 | $22,131 | $3,626 | $18,505 |
| 2019 | $4,279 | $24,590 | $3,626 | $20,964 |
| 2018 | $4,206 | $24,590 | $3,626 | $20,964 |
| 2017 | $3,410 | $19,110 | $3,263 | $15,847 |
| 2016 | $3,349 | $19,110 | $3,263 | $15,847 |
| 2015 | $3,043 | $19,110 | $3,263 | $15,847 |
| 2014 | $3,364 | $20,559 | $3,082 | $17,477 |
| 2013 | $3,287 | $20,559 | $3,082 | $17,477 |
Source: Public Records
Map
Nearby Homes
- 6051 S Normandy Ave
- 5700 S Neenah Ave
- 5819 S Newcastle Ave
- 5820 S Narragansett Ave
- 5642 S Natchez Ave
- 5622 S Oak Park Ave
- 5536 S Normandy Ave
- 5519 S Nashville Ave
- 5749 S Nordica Ave
- 6305 S Nashville Ave Unit 2S
- 6721 W 63rd St
- 6158 W 60th St Unit 10
- 6628 W 63rd Place
- 5734 S Melvina Ave
- 5431 S Natoma Ave
- 5520 S New England Ave
- 6319 S Oak Park Ave Unit 3B
- 5723 S Melvina Ave
- 5400 S Nashville Ave
- 6237 S Newland Ave Unit 1N
- 6621 W 59th St
- 6619 W 59th St
- 6617 W 59th St
- 6635 W 59th St
- 5915 S Natoma Ave
- 6613 W 59th St
- 6637 W 59th St
- 5917 S Natoma Ave
- 6611 W 59th St
- 5859 S Natoma Ave
- 6641 W 59th St
- 5921 S Natoma Ave
- 5914 S Natoma Ave
- 6607 W 59th St
- 5855 S Natoma Ave
- 6645 W 59th St
- 5916 S Natoma Ave
- 5925 S Natoma Ave
- 6605 W 59th St
- 5853 S Natoma Ave
Your Personal Tour Guide
Ask me questions while you tour the home.